Turn on suggestions
Auto-suggest helps you quickly narrow down your search results by suggesting possible matches as you type.
Showing results for
- STMicroelectronics Community
- STM32 MCUs Software development tools
- STM32CubeIDE (MCUs)
- Re: STM32CubeIDE-- how to use SWV data trace timel...
Options
- Subscribe to RSS Feed
- Mark Topic as New
- Mark Topic as Read
- Float this Topic for Current User
- Bookmark
- Subscribe
- Mute
- Printer Friendly Page
STM32CubeIDE-- how to use SWV data trace timeline graph
Options
- Mark as New
- Bookmark
- Subscribe
- Mute
- Subscribe to RSS Feed
- Permalink
- Email to a Friend
- Report Inappropriate Content
2019-06-26 9:52 PM
Hello, now I'm using F429IDiscovey and STM32CubeIDE to grahp via SWV.
I refre to this official video(URL: https://www.youtube.com/watch?v=eumKLXNlM0U)
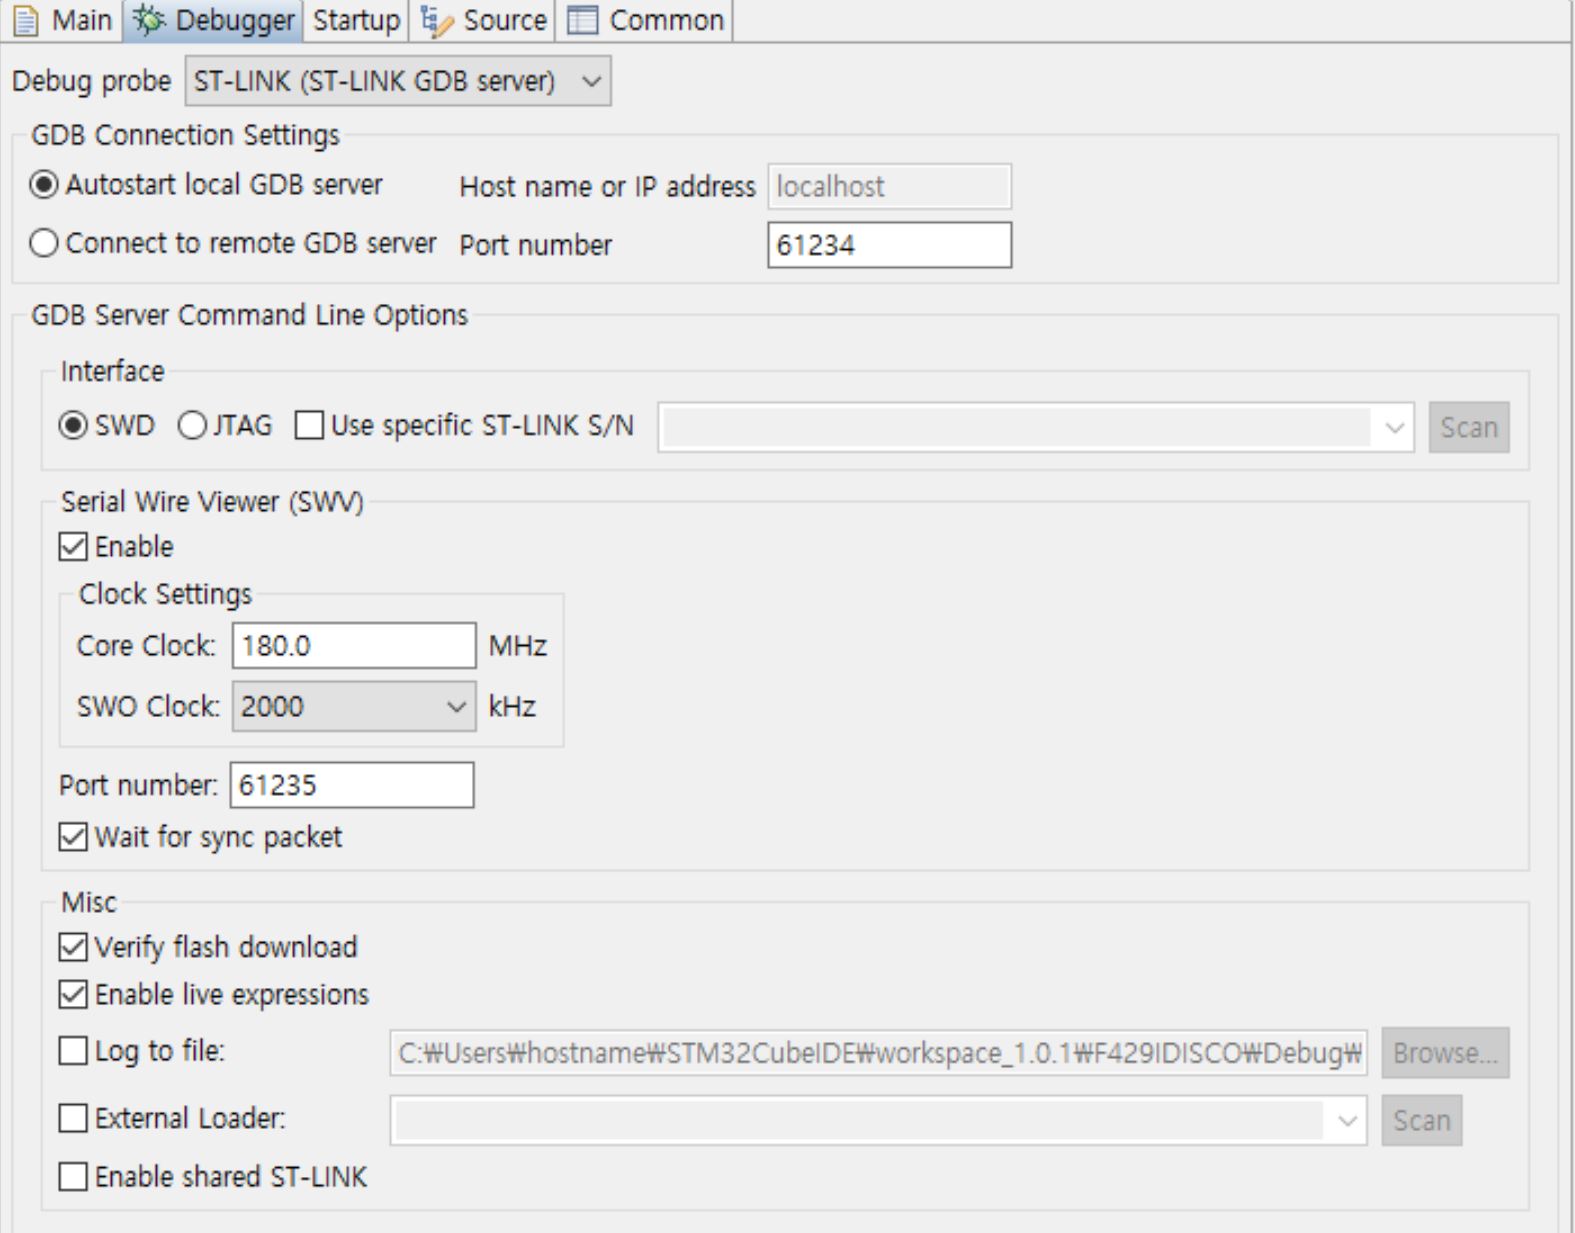
In the STM32CubeIDE, I configured same like video.
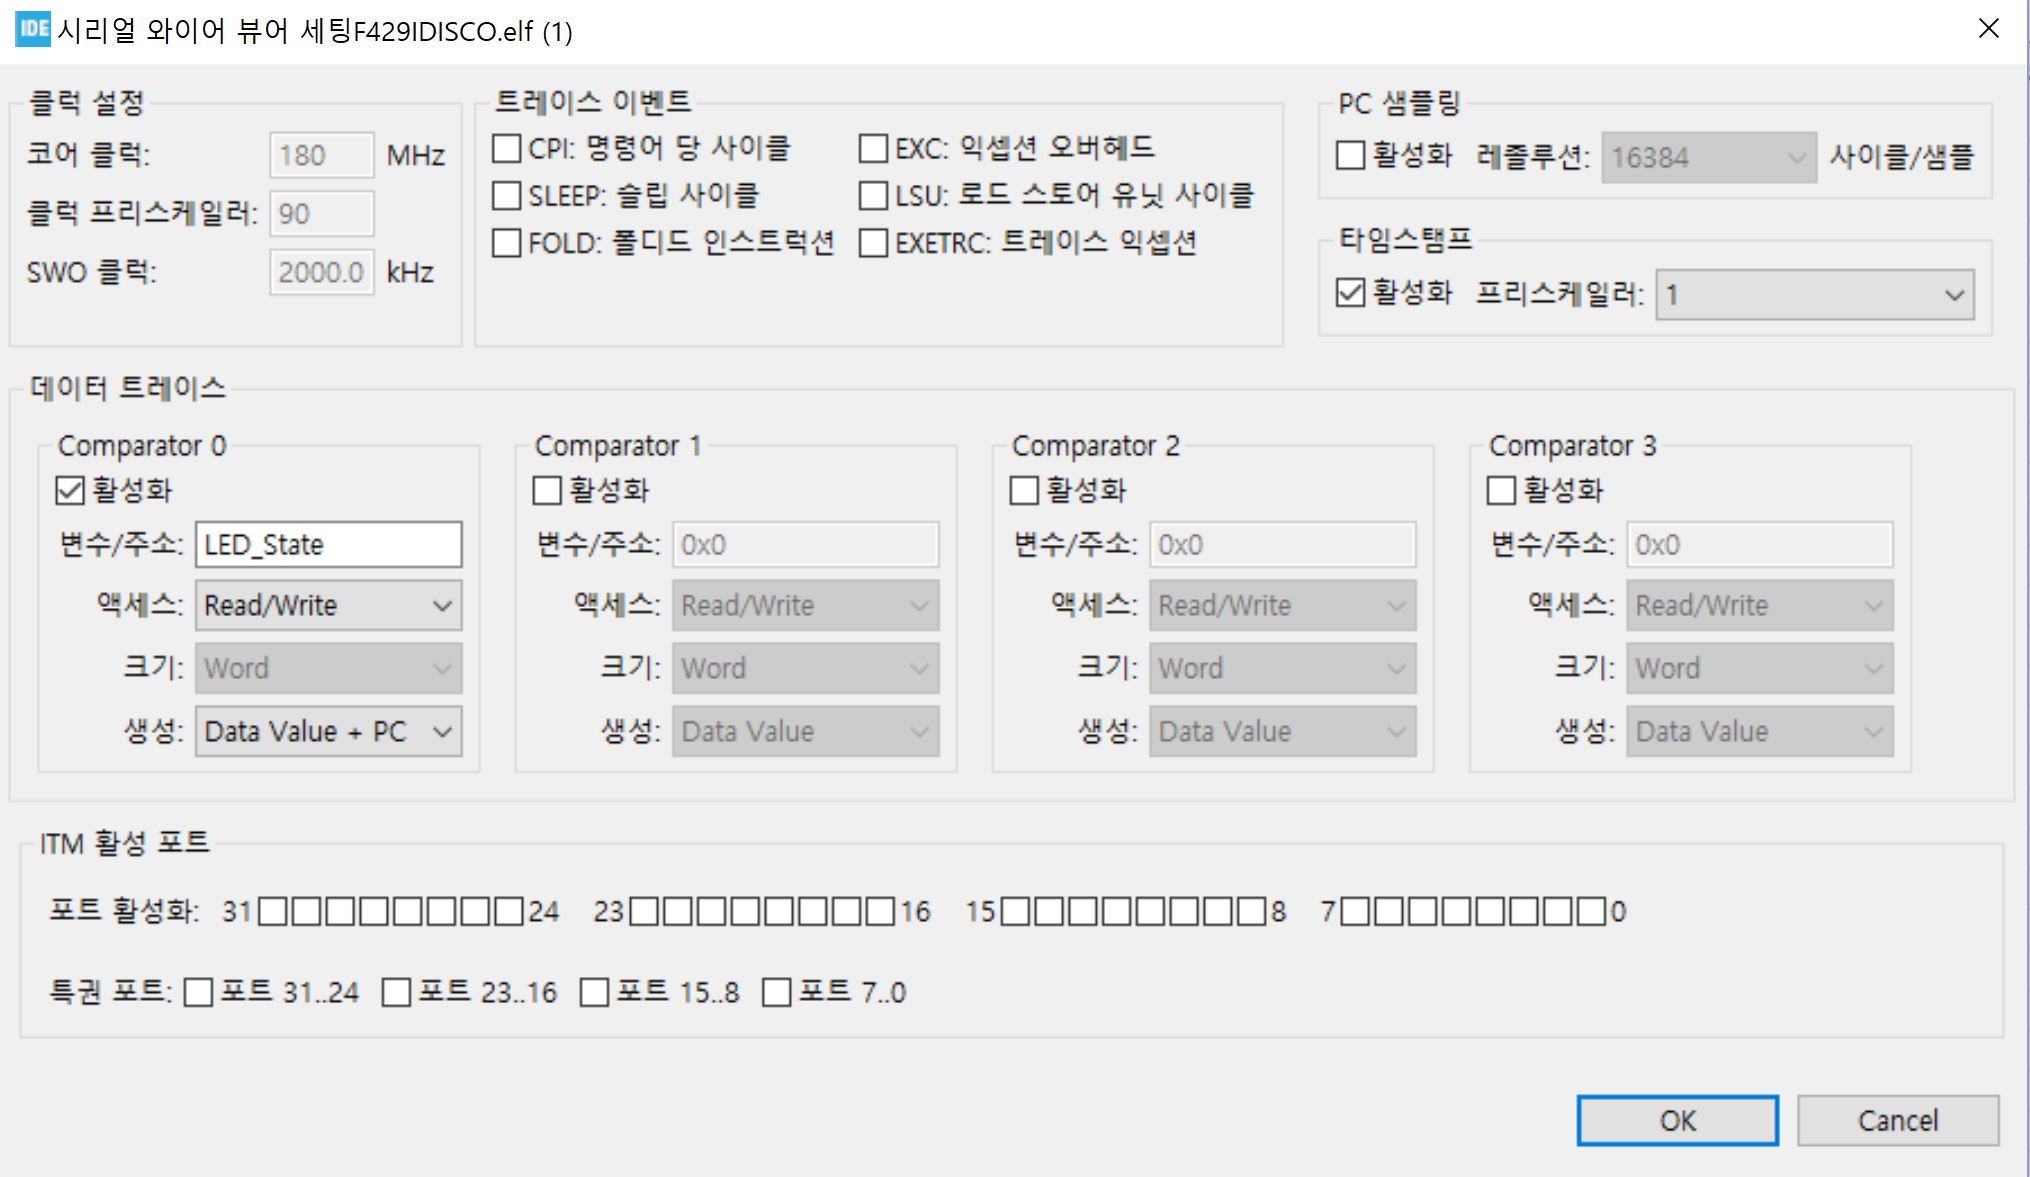
(Please see the attached file named 'SWV_Config' and 'Debug Config')
After configuration, I can run debug mode normally.
Also I can check variable(LED_state) that get value 1 and 0 per 500ms as I coded.
But I cannot any graph on the SWV Data Trace Timeline Graph...
(Please see the attached file named 'LED_State=0' and 'LED_State=1')
Do I miss something? How can I fix?
Thank you in advance
Solved! Go to Solution.
Labels:
- Labels:
-
DEBUG
-
STM32CubeIDE
-
STM32F4 Series
24 REPLIES 24
Options
- Mark as New
- Bookmark
- Subscribe
- Mute
- Subscribe to RSS Feed
- Permalink
- Email to a Friend
- Report Inappropriate Content
2020-11-12 7:19 PM
I am using STM32CubeIDE and a Nucleo-68 board from the Nucleo pack (P-NUCLEO-WB55) with the same problem. I can see the variable is changing but nothing can be seen on the SWV Data Trace Timeline Graph. Do I have to use a jumper or solder bridge etc. to take care of SWO?
Options
- Mark as New
- Bookmark
- Subscribe
- Mute
- Subscribe to RSS Feed
- Permalink
- Email to a Friend
- Report Inappropriate Content
2020-11-14 6:57 PM
Check if your jumpers are in the correct spot.
Options
- Mark as New
- Bookmark
- Subscribe
- Mute
- Subscribe to RSS Feed
- Permalink
- Email to a Friend
- Report Inappropriate Content
2020-11-14 7:27 PM
Thank you for your suggestion. I have root caused the reason: I did not setup the variable correctly. My variable is updated in the while 1 loop but not read by the software. If I set Access as "Read", then no waveform is shown. Once I change the access to Read/Write or Write, I am able to see the graph
Options
- Mark as New
- Bookmark
- Subscribe
- Mute
- Subscribe to RSS Feed
- Permalink
- Email to a Friend
- Report Inappropriate Content
2020-11-14 7:29 PM
I have root caused the reason: My variable is only updated in the while 1 loop but not read by the software at all. If I set Access as "Read", then no waveform is shown because the variable is never read. Once I change the access to "Read/Write" or "Write", I am able to see the graph because the data trace is triggered with each write.

Options
- Mark as New
- Bookmark
- Subscribe
- Mute
- Subscribe to RSS Feed
- Permalink
- Email to a Friend
- Report Inappropriate Content
2021-10-08 4:26 PM
Have you set correct HCLK frequency in Run Configuration -> Debugger -> SWV (Enable)-> Core Clock? On YouTube examples show 80MHz but your board may have different default set - for example 216MHz. Check it in *.ioc -> Clock Configuration -> HCLK (MHz)

Options
- Mark as New
- Bookmark
- Subscribe
- Mute
- Subscribe to RSS Feed
- Permalink
- Email to a Friend
- Report Inappropriate Content
2022-07-19 6:05 AM
In my case the debugging settings are grayed out. Does somebody know what this means? And the SWV Data Trace cannot be configured, no window opens. Thank you for any suggestions. I am using a J-Link debugging probe and I have the Version:
Version: 1.10.0
Build: 12671_20220627_1643 (UTC)
with: stm32g071CBUx

Options
- Mark as New
- Bookmark
- Subscribe
- Mute
- Subscribe to RSS Feed
- Permalink
- Email to a Friend
- Report Inappropriate Content
2022-12-30 6:24 PM
December 2022, and this really does not work, following the exact instructions, with a genuine stlink v3, or a segger jlink, with CubeIDE, and any of F303CB, F405RG or L431RC.
The graph. simply does not respond, and on the odd occasion where it does, the data is garbage - reports values like 4500000000000000000000000000 on a float that the live expressions viewer sees is about 0.0234234 (a current reading in A).
Would be really useful to have a plotter of some sort. Doesn't sound like it should be very complicated...
Options
- Mark as New
- Bookmark
- Subscribe
- Mute
- Subscribe to RSS Feed
- Permalink
- Email to a Friend
- Report Inappropriate Content
2022-12-30 6:31 PM
Here is an example.

I think at this stage I must have tried every single option box and combination there is.
Options
- Mark as New
- Bookmark
- Subscribe
- Mute
- Subscribe to RSS Feed
- Permalink
- Email to a Friend
- Report Inappropriate Content
2022-12-31 1:46 AM
you have "core clk" at 8 MHz -- but isnt it more 80 or 100 MHz ?
+
btw
i just tried my new stlink V3 (mods) , but this actual shows no swv data.
my old stklink V2 (clone :) ) working fine (almost - sometimes overflow exception logged)
If you feel a post has answered your question, please click "Accept as Solution".
Options
- Mark as New
- Bookmark
- Subscribe
- Mute
- Subscribe to RSS Feed
- Permalink
- Email to a Friend
- Report Inappropriate Content
2022-12-31 6:30 AM
Thanks AScha.3! Core is 168MHz. I swapped to that and it immediately started working... badly. I had assumed this 8MHz value was to do with the debugger itself, not the core clock of my mcu, since it was greyed out and auto populated. Changed it in the debug config and started to get data out of it but with all sorts of glitches, and the interface simply cannot handle the amount of data it gets sent...
It also seems to be tripping the BRK, or perhaps the clock fault on the timer. MOE keeps tripping to zero, which never happens when SWV is not being used.
However, somehow this made the Segger j-scope work where it did not before (presumably embedded in the elf file or segger settings somewhere) which works pretty nicely. No MOE tripping there. I now have a nice functional scope.


Related Content
- I cant see the trace in STM32 in STM32CubeIDE (MCUs)
- Is STM32CubeIDE having a deliver end date? in STM32CubeIDE (MCUs)
- SVW console - no output after few seconds in STM32CubeIDE (MCUs)
- STM32CubeMonitor 1.7.0 used with a Nucleo-H563ZI only gets the value 0 from the processor. in STM32CubeMonitor (MCUs)
- STM32CubeIDE - how to change the color and line thickness in SWV timeline graph? in STM32CubeIDE (MCUs)