- STMicroelectronics Community
- STM32 MCUs Software development tools
- STM32CubeIDE (MCUs)
- Re: How to enable Tracing in STM32Cube
- Subscribe to RSS Feed
- Mark Topic as New
- Mark Topic as Read
- Float this Topic for Current User
- Bookmark
- Subscribe
- Mute
- Printer Friendly Page
How to enable Tracing in STM32Cube
- Mark as New
- Bookmark
- Subscribe
- Mute
- Subscribe to RSS Feed
- Permalink
- Email to a Friend
- Report Inappropriate Content
2021-03-14 08:42 AM

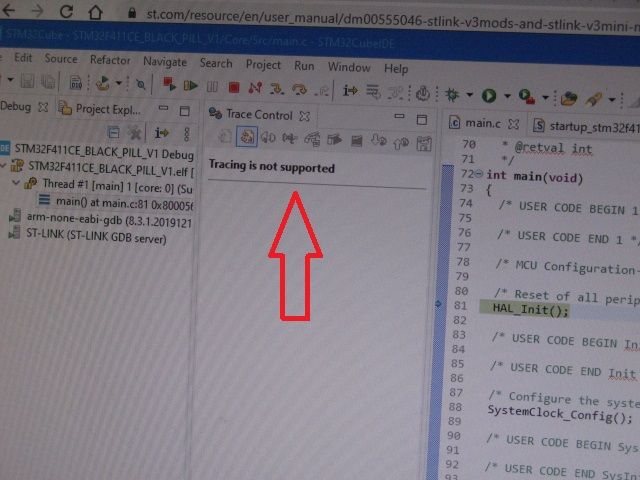
I am trying to get tracing working and when i start the debugger this window pops up saying "Tracing is not supported".
Any one have any idea what it means as i can't find any reference to it.
I have a STM32F411CEU6, watched many how videos and configured everything.
I have STLINKV3MINI with latest update, Cube is Version 1.6.
Turned on all the features I need to but Tracing I guess won't run as somewhere/how i have not enabled something.
I have added SWO wire to the the B3 pin/STLINKV3MINI and can see it streaming data on my scope
Any ideas please as i have spent five days trying to get this to work =)
Many thanks in advance imk
Solved! Go to Solution.
- Labels:
-
DEBUG
-
STM32CubeIDE
-
STM32F4 Series
Accepted Solutions
- Mark as New
- Bookmark
- Subscribe
- Mute
- Subscribe to RSS Feed
- Permalink
- Email to a Friend
- Report Inappropriate Content
2021-03-15 06:08 AM
Hello KnarfB and many thanks for the help.
So someone on another forum has tried my project and got it to start tracing by changing the port to 61235
So i have changed my port to 61235 and it works :)
However look at the output from the Debug session startup, it has both 61234 and 61235 port startup requests.
Many thanks Ian
STMicroelectronics ST-LINK GDB server. Version 5.8.0
Copyright (c) 2020, STMicroelectronics. All rights reserved.
Starting server with the following options:
Persistent Mode : Disabled
LogFile Name : D:\NewDev\STM32Cube\STM32F411CE_BLACK_PILL_V1\Debug\st-link_gdbserver_log.txt
Logging Level : 31
Listen Port Number : 61235
Status Refresh Delay : 15s
Verbose Mode : Enabled
SWD Debug : Enabled
Target connection mode: Attach
Reading ROM table for AP 0 @0xe00fffd0
Hardware watchpoint supported by the target
COM frequency = 24000 kHz
ST-LINK Firmware version : V3J7M3
Device ID: 0x431
PC: 0x75f9e0
ST-LINK device status: RUN_MODE
ST-LINK detects target voltage = 3.25 V
ST-LINK device status: RUN_MODE
ST-LINK device initialization OK
Waiting for debugger connection...
Waiting for connection on port 61235...
Waiting for connection on port 61234...
Accepted connection on port 61235...
Debugger connected
Try halt...
ST-LINK device status: HALT_MODE
Enter STM32_AppReset() function
NVIC_DFSR_REG = 0x00000008
NVIC_CFGFSR_REG = 0x00000000
Accepted connection on port 61234...
------ Switching to STM32CubeProgrammer -----
-------------------------------------------------------------------
STM32CubeProgrammer v2.7.0-RC1
-------------------------------------------------------------------
Log output file: C:\Users\Me\AppData\Local\Temp\STM32CubeProgrammer_a20436.log
ST-LINK SN : 003F002B5553500720393256
ST-LINK FW : V3J7M3
Board : STLINK-V3MINI
Voltage : 3.32V
SWD freq : 24000 KHz
Connect mode: Under Reset
Reset mode : Hardware reset
Device ID : 0x431
Revision ID : Rev A
Device name : STM32F411xC/E
Flash size : 512 KBytes
Device type : MCU
Device CPU : Cortex-M4
Memory Programming ...
Opening and parsing file: ST-LINK_GDB_server_a20436.srec
File : ST-LINK_GDB_server_a20436.srec
Size : 9040 Bytes
Address : 0x08000000
Erasing memory corresponding to segment 0:
Erasing internal memory sector 0
Download in Progress:
�������������������������������������������������� 0%
�������������������������������������������������� 100%
File download complete
Time elapsed during download operation: 00:00:00.305
Verifying ...
Read progress:
�������������������������������������������������� 50%
����������� 22%����� 33%������ 45%������ 56%����� 67%������ 79%������ 90%����� 100%
Download verified successfully
------ Switching context -----
Target connection mode: Default
Reading ROM table for AP 0 @0xe00fffd0
Hardware watchpoint supported by the target
COM frequency = 24000 kHz
ST-LINK Firmware version : V3J7M3
Device ID: 0x431
PC: 0x8000968
ST-LINK detects target voltage = 3.32 V
ST-LINK device status: HALT_MODE
ST-LINK device initialization OK
SWV_SetStatus(true): stop_reply_pending == 0
handle_vCont_c, continue thread
SWV_SetStatus(false): stop_reply_pending == 1
TraceCaptureStart and SWV event set to APP_FALSE (0)
NVIC_DFSR_REG = 0x0000000A
- Mark as New
- Bookmark
- Subscribe
- Mute
- Subscribe to RSS Feed
- Permalink
- Email to a Friend
- Report Inappropriate Content
2021-03-14 02:03 PM
Not sure what exactly you want to trace, but check out the SWV Views and app note AN4989 "STM32 microcontroller debug toolbox" to get an idea what's possible.
hth
KnarfB
- Mark as New
- Bookmark
- Subscribe
- Mute
- Subscribe to RSS Feed
- Permalink
- Email to a Friend
- Report Inappropriate Content
2021-03-14 02:45 PM
Hello KnarfB and many thanks for the reply.
I am trying to do a "SWV Data Trace Timeline Graph " tracing of a variable in the main loop.
Same as in this ST video https://www.youtube.com/watch?v=eumKLXNlM0U.
But in five days of trying i have been unable to get the graphic or data traces to show and results.
The Live Expression of the variables works as expected, but nothing from the SWV trace.
I think i have found a bug in this Three Week old 1.6 version of Cube or STLINKV3 both of which are new.
As all the video of previous versions with STLINKV2 seem to work.
So not sure what to do, maybe order up a STLINKV2 and install STM32CubeIDE 1.51
Have you got it working and what hard/software versions please?
Many thanks Ian
- Mark as New
- Bookmark
- Subscribe
- Mute
- Subscribe to RSS Feed
- Permalink
- Email to a Friend
- Report Inappropriate Content
2021-03-15 01:36 AM
Hi,
I checked my setup today with STM32CubeIDE Version: 1.6.0 Build: 9614_20210223_1703 (UTC) and two Nucleo boards: F446RE (ST-LINKV2) G431RE (ST-LINKV3). No external ST-LINK though.
No issues, both worked as expected. The TrueStudio video is more detailed and applies to CubeIDE as well: https://youtu.be/XhBiDykSS4I. Double check that the core clock in Debug Configuration and SWV Views match. You may also try with low(er) SWO clock to rule out electrical issues.
STM32CubeProgrammer also supports SWV ITM_SendChar (printf redirection) and you might use that as a somehow independend check.
hth
KnarfB
- Mark as New
- Bookmark
- Subscribe
- Mute
- Subscribe to RSS Feed
- Permalink
- Email to a Friend
- Report Inappropriate Content
2021-03-15 04:22 AM

Noted that it works for you and i am most grateful as this is some assurance that it does work in 1.6 so maybe my STLINKV3 (I don't think so)
However I have posted this to another forum and someone on that forum has downloaded my project and found that it does NOT work in V1.6
However when they create a project themselves the trace function works in v1.6.
Hence there is something wrong with my project, the problem is what.
I have already watched the video you sent me (many thanks) and about another dozen videos and have regenerated this project COUNTLESS times.
So i am wondering if multiple regeneration have messed up the project.
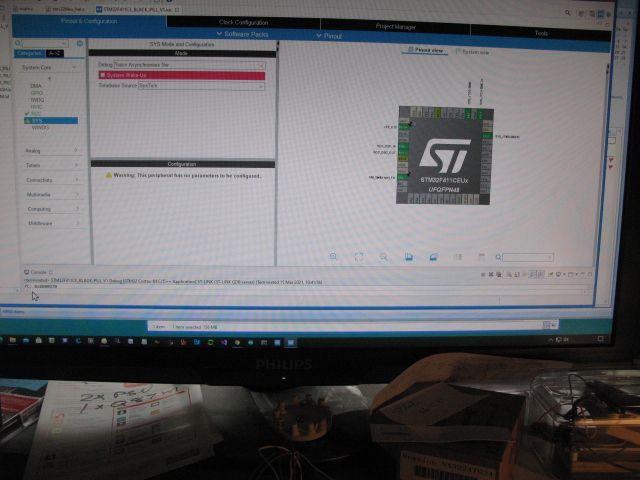
BTW what should i be setting up in .IOC SYS Mode and Configuration please as i get a red bar warning.
see photo
Again many thanks for the help imk
- Mark as New
- Bookmark
- Subscribe
- Mute
- Subscribe to RSS Feed
- Permalink
- Email to a Friend
- Report Inappropriate Content
2021-03-15 06:08 AM
Hello KnarfB and many thanks for the help.
So someone on another forum has tried my project and got it to start tracing by changing the port to 61235
So i have changed my port to 61235 and it works :)
However look at the output from the Debug session startup, it has both 61234 and 61235 port startup requests.
Many thanks Ian
STMicroelectronics ST-LINK GDB server. Version 5.8.0
Copyright (c) 2020, STMicroelectronics. All rights reserved.
Starting server with the following options:
Persistent Mode : Disabled
LogFile Name : D:\NewDev\STM32Cube\STM32F411CE_BLACK_PILL_V1\Debug\st-link_gdbserver_log.txt
Logging Level : 31
Listen Port Number : 61235
Status Refresh Delay : 15s
Verbose Mode : Enabled
SWD Debug : Enabled
Target connection mode: Attach
Reading ROM table for AP 0 @0xe00fffd0
Hardware watchpoint supported by the target
COM frequency = 24000 kHz
ST-LINK Firmware version : V3J7M3
Device ID: 0x431
PC: 0x75f9e0
ST-LINK device status: RUN_MODE
ST-LINK detects target voltage = 3.25 V
ST-LINK device status: RUN_MODE
ST-LINK device initialization OK
Waiting for debugger connection...
Waiting for connection on port 61235...
Waiting for connection on port 61234...
Accepted connection on port 61235...
Debugger connected
Try halt...
ST-LINK device status: HALT_MODE
Enter STM32_AppReset() function
NVIC_DFSR_REG = 0x00000008
NVIC_CFGFSR_REG = 0x00000000
Accepted connection on port 61234...
------ Switching to STM32CubeProgrammer -----
-------------------------------------------------------------------
STM32CubeProgrammer v2.7.0-RC1
-------------------------------------------------------------------
Log output file: C:\Users\Me\AppData\Local\Temp\STM32CubeProgrammer_a20436.log
ST-LINK SN : 003F002B5553500720393256
ST-LINK FW : V3J7M3
Board : STLINK-V3MINI
Voltage : 3.32V
SWD freq : 24000 KHz
Connect mode: Under Reset
Reset mode : Hardware reset
Device ID : 0x431
Revision ID : Rev A
Device name : STM32F411xC/E
Flash size : 512 KBytes
Device type : MCU
Device CPU : Cortex-M4
Memory Programming ...
Opening and parsing file: ST-LINK_GDB_server_a20436.srec
File : ST-LINK_GDB_server_a20436.srec
Size : 9040 Bytes
Address : 0x08000000
Erasing memory corresponding to segment 0:
Erasing internal memory sector 0
Download in Progress:
�������������������������������������������������� 0%
�������������������������������������������������� 100%
File download complete
Time elapsed during download operation: 00:00:00.305
Verifying ...
Read progress:
�������������������������������������������������� 50%
����������� 22%����� 33%������ 45%������ 56%����� 67%������ 79%������ 90%����� 100%
Download verified successfully
------ Switching context -----
Target connection mode: Default
Reading ROM table for AP 0 @0xe00fffd0
Hardware watchpoint supported by the target
COM frequency = 24000 kHz
ST-LINK Firmware version : V3J7M3
Device ID: 0x431
PC: 0x8000968
ST-LINK detects target voltage = 3.32 V
ST-LINK device status: HALT_MODE
ST-LINK device initialization OK
SWV_SetStatus(true): stop_reply_pending == 0
handle_vCont_c, continue thread
SWV_SetStatus(false): stop_reply_pending == 1
TraceCaptureStart and SWV event set to APP_FALSE (0)
NVIC_DFSR_REG = 0x0000000A
- Mark as New
- Bookmark
- Subscribe
- Mute
- Subscribe to RSS Feed
- Permalink
- Email to a Friend
- Report Inappropriate Content
2021-03-15 07:26 AM
Hi Ian,
glad you found it.
The red bar warning only means that you cannot activate that feature (wakeup-pin) because the resources are already allocated elsewhere. Hovering with the mouse over the bar should reveal a more detailed explanation.
hth
KnarfB
- Problems with RTEdbg toolkit log/trace data transfer via ST-LINK in STM32CubeIDE (MCUs)
- stm32f0 EXTI cubemx platformio in STM32CubeMX (MCUs)
- Copying Firmware example to new location causes unexpected error in STM32CubeIDE (MCUs)
- LWIP and FREERTOS undefined reference after HTTPD is enabled in STM32CubeMX (MCUs)
- Is that possible to enable/disable editing the generated code with CubeMx in STM32CubeMX (MCUs)