- STMicroelectronics Community
- STM32 MCUs
- STM32 MCUs Products
- Debugging Skill and Pull Down Resistor
- Subscribe to RSS Feed
- Mark Topic as New
- Mark Topic as Read
- Float this Topic for Current User
- Bookmark
- Subscribe
- Mute
- Printer Friendly Page
Debugging Skill and Pull Down Resistor
- Mark as New
- Bookmark
- Subscribe
- Mute
- Subscribe to RSS Feed
- Permalink
- Email to a Friend
- Report Inappropriate Content
2017-07-10 03:15 PM
Hi,
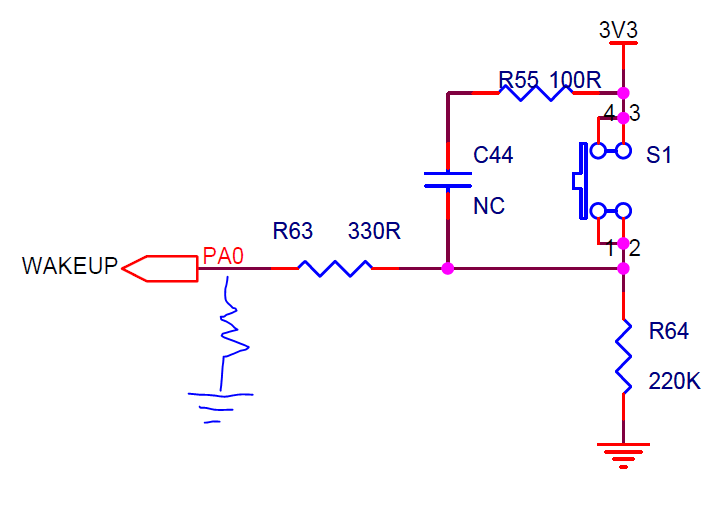
I have a quick question about the pull-up and the pull-down resistor. For example, I want to use the switch (S1) to control the output of the GPIO pin (PA0), and read this output to turn on/off another LED. When I set the GPIO pin,
GPIO_InitStructure.GPIO_Pin = GPIO_Pin_0;
GPIO_InitStructure.GPIO_Mode = GPIO_Mode_IN; GPIO_InitStructure.GPIO_PuPd = GPIO_PuPd_DOWN; GPIO_Init(GPIOA, &GPIO_InitStructure);I can make the program work as I expected when I set it to be pull-down or NOPULL (float?). After some searching online, my understanding is that when I set the pin to have a pull-down resistor, there is a pull-down resistor shown in the figure, the PA0 is 0 when S1 is open and is 1 when S1 is closed. Is my understanding correct?

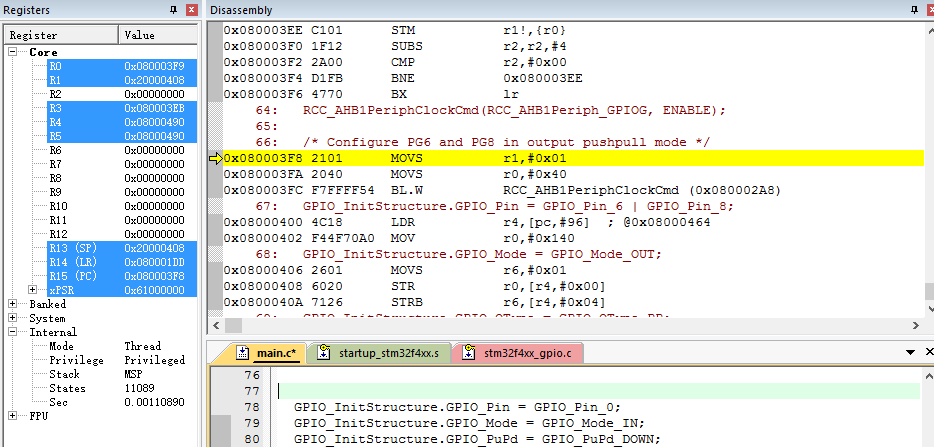
Also, when I use the debugmode in Keil, there are a register block and a disassembly block shown on the screen but I do not know how to use them. For example, I want to see the output of the pin PA0 in each step (when I press S1 or release S1), which part shall I look at?

Another minor question is that what will happen if I mistakenly set the mode to be pull-up. Will the output always be HIGH, or somewhere randomly between HIGH and HIGH/2 (since I guess pull-up resistor and R64 divide the voltage by half)?
Thank you for your help!
#keil #pull-down #stm-32f407 #pull-up #debug #gpio Note: this post was migrated and contained many threaded conversations, some content may be missing.Solved! Go to Solution.
- Labels:
-
DEBUG
-
GPIO-EXTI
-
Keil
-
STM32F4 Series
Accepted Solutions
- Mark as New
- Bookmark
- Subscribe
- Mute
- Subscribe to RSS Feed
- Permalink
- Email to a Friend
- Report Inappropriate Content
2017-07-11 11:16 PM
Hello
In order to view a GPIO pin, you can use the System Viewer in uVision.
While in Debug mode, select Peripheral/System Viewer from the toolbar and then select the peripheral you want.
The peripheral registers update (if they are allowed to by the STM32) while the program runs and is non-intrusive.
Look at page 15:
http://www.keil.com/appnotes/docs/apnt_253.asp
You can also use a Watch window if you have a global or static variable. Sometimes you can set Watch on the physical address of the peripheral. Look in the System Viewer to find this address. Watch and Memory windows also update while the program runs and do not steal CPU cycles to do this.
There is the new Event Recorder - you can annotate your code but this is non-intrusive.
If you are using a Cortex-M3, M4, M7 you can use the Logic Analyzer to view a variable graphically. This is also described in the appnote mentioned above and is non-intrusive.
Good luck !
Bob
- Mark as New
- Bookmark
- Subscribe
- Mute
- Subscribe to RSS Feed
- Permalink
- Email to a Friend
- Report Inappropriate Content
2017-07-10 05:51 PM
The pull up/down is nominally 50KOhm +/-20%, check the Data Sheet for your specific part.
It's going to act like a resistor if you switch in to the circuit, not behave randomly. The voltage on the pin will determine the level read, per VIL and VIH specs.
Up vote any posts that you find helpful, it shows what's working..
- Mark as New
- Bookmark
- Subscribe
- Mute
- Subscribe to RSS Feed
- Permalink
- Email to a Friend
- Report Inappropriate Content
2017-07-11 11:16 PM
Hello
In order to view a GPIO pin, you can use the System Viewer in uVision.
While in Debug mode, select Peripheral/System Viewer from the toolbar and then select the peripheral you want.
The peripheral registers update (if they are allowed to by the STM32) while the program runs and is non-intrusive.
Look at page 15:
http://www.keil.com/appnotes/docs/apnt_253.asp
You can also use a Watch window if you have a global or static variable. Sometimes you can set Watch on the physical address of the peripheral. Look in the System Viewer to find this address. Watch and Memory windows also update while the program runs and do not steal CPU cycles to do this.
There is the new Event Recorder - you can annotate your code but this is non-intrusive.
If you are using a Cortex-M3, M4, M7 you can use the Logic Analyzer to view a variable graphically. This is also described in the appnote mentioned above and is non-intrusive.
Good luck !
Bob
- Mark as New
- Bookmark
- Subscribe
- Mute
- Subscribe to RSS Feed
- Permalink
- Email to a Friend
- Report Inappropriate Content
2017-07-12 04:40 PM
Hi Bob,
Thanks for your reply! When I selected View->System Viewer, there is nothing in the submenu and I could not see any system viewer window shown when in the debug mode. I could open the Watch window though (and when I typed GPIOA, I could monitor all the registers). I used J-Link/J-Trace Cortex and set the Port to be SW. In Utilities, I chose J-Link/J-Trace Cortex and add STMF4xx Flash in the settings. Do you know how to solve the problem to see the GPIO pins like in page 15 of the tutorial? Thanks for your help!
- Mark as New
- Bookmark
- Subscribe
- Mute
- Subscribe to RSS Feed
- Permalink
- Email to a Friend
- Report Inappropriate Content
2017-07-12 04:50 PM
Hello
What version MDK are you using ?
What board ?
This information is provided by a file CPUname.svd.
It is selected when you select the processor.
Bob
bob.boys@arm.com
________________ Attachments : image001.jpg : https://st--c.eu10.content.force.com/sfc/dist/version/download/?oid=00Db0000000YtG6&ids=0680X000006HyYx&d=%2Fa%2F0X0000000b9f%2FqSUOH8qX48S12ax7ClpDtCSjI4KlBj6XNISSzJKUxr0&asPdf=false- Mark as New
- Bookmark
- Subscribe
- Mute
- Subscribe to RSS Feed
- Permalink
- Email to a Friend
- Report Inappropriate Content
2017-07-12 05:14 PM
Hi,
I am using uVision 4. The processor I am using is STM32F407 but I am using another evaluation board other than the Discovery series.
- Mark as New
- Bookmark
- Subscribe
- Mute
- Subscribe to RSS Feed
- Permalink
- Email to a Friend
- Report Inappropriate Content
2017-07-12 05:17 PM
This number:
________________ Attachments : image001.png : https://st--c.eu10.content.force.com/sfc/dist/version/download/?oid=00Db0000000YtG6&ids=0680X000006HyYO&d=%2Fa%2F0X0000000b9c%2FB02jrQ2ZH557BqYIxH7JzAbI2IgJOzJK.p9RccW.01A&asPdf=falseimage003.jpg : https://st--c.eu10.content.force.com/sfc/dist/version/download/?oid=00Db0000000YtG6&ids=0680X000006HyWN&d=%2Fa%2F0X0000000b9d%2FitcBX8LGTQENBuMHgvifaEEAMhg40ufYcfmKk_kRAr8&asPdf=false- Mark as New
- Bookmark
- Subscribe
- Mute
- Subscribe to RSS Feed
- Permalink
- Email to a Friend
- Report Inappropriate Content
2017-07-12 07:04 PM
It is V4.70.0.0.
- Mark as New
- Bookmark
- Subscribe
- Mute
- Subscribe to RSS Feed
- Permalink
- Email to a Friend
- Report Inappropriate Content
2017-07-12 07:21 PM
Hi
That is quite old.
We are at 5.24 already.
Is there a reason you are using an old version ?
You can reply to bob.boys@arm.com<mailto:bob.boys@arm.com>
Bob
________________ Attachments : image001.jpg : https://st--c.eu10.content.force.com/sfc/dist/version/download/?oid=00Db0000000YtG6&ids=0680X000006HyW9&d=%2Fa%2F0X0000000b9e%2FZ4XsIudQJ75vzkzLSKRVpuUdoiMZny6ObzF59_loJSI&asPdf=false- Mark as New
- Bookmark
- Subscribe
- Mute
- Subscribe to RSS Feed
- Permalink
- Email to a Friend
- Report Inappropriate Content
2017-07-12 08:09 PM
Hi,
No particular reason. It was just installed on my computer a few years ago @_@. Thanks!
- skills: How to read DBUMCU correct without debugging in STM32 MCUs Products
- Issue with USB CDC-ACM on STM32U5G9ZJT6Q - Device Not Recognized in Device Manager in STM32 MCUs Embedded software
- After I program the board with j link the program doesnot run unless power is re-applied in STM32CubeIDE (MCUs)
- USB virtual COM port does not work when debugging in STM32 MCUs Embedded software
- G431 Config of input interrupt prevents timer 8 from working. in STM32 MCUs Products