Turn on suggestions
Auto-suggest helps you quickly narrow down your search results by suggesting possible matches as you type.
Showing results for
- STMicroelectronics Community
- STM32 MCUs Software development tools
- STM32CubeIDE (MCUs)
- Compiler optimized program has errors
Options
- Subscribe to RSS Feed
- Mark Topic as New
- Mark Topic as Read
- Float this Topic for Current User
- Bookmark
- Subscribe
- Mute
- Printer Friendly Page
Compiler optimized program has errors
Options
- Mark as New
- Bookmark
- Subscribe
- Mute
- Subscribe to RSS Feed
- Permalink
- Email to a Friend
- Report Inappropriate Content
2024-03-19 12:01 AM - edited 2024-03-20 1:22 AM
While trying to debug a problem, it seems that another one is giving me a hard time.
One function call is not shown, another has the wrong name ("writeFLASHDoubleWord" should be "waitForBusy").
The breakpoint is also missed.
Originally the code worked, but then i moved to the new prototype. I copied the project, and made a few minor changes. Mainly just the pins.
I had some hardfault before, which happend seemingly at "CLEAR_BIT(FLASH->CR, FLASH_CR_PG);" after writing FLASH. But after seeing the above, i doubt this!
Labels:
- Labels:
-
STM32G4 Series
This discussion is locked. Please start a new topic to ask your question.
37 REPLIES 37
Options
- Mark as New
- Bookmark
- Subscribe
- Mute
- Subscribe to RSS Feed
- Permalink
- Email to a Friend
- Report Inappropriate Content
2024-03-19 12:50 AM
When you see a "wrong" call trace, strange jumping through your code - my first thought would be: the memory is corrupted.
Any write operation, e.g. writing a buffer, writes to a wrong location, writes beyond the buffer size... Many reasons why to see a "strange" call trace:
- the code is corrupted ("it jumps strange")
- the stack is corrupted ("it does not come back from function call in the right way, e.g. registers restored are wrong")
- the stack is too small ("a function called writes outside stack region")
- you have not enable something needed ("the code assumes all is enabled and does not check for errors")
- you malloc (head) region overflows ("malloc called without a check if successful and keep going with wrong pointer")
- with the debug compile option: the code image contains additional (helper code and meta data) debug info:
even this can be damaged (and wrong reports)
I would assume first (if debug trace looks "wrong" or "strange"): the memory content is corrupted.
When you say: "I had some hardfault before": have you fixed these issue? Or did they disappear just by adding more code? If so - the root cause is still there, just hidden and now hitting you again.
I assume, you have a bug somewhere in your code: check all writes, memory handling, memory sizes (e.g. heap for malloc, stack size), code writing to memory (buffers), all needed stuff enabled, if you handle "errors" properly (not ignoring issues, not to keep going when anything went wrong already)...
Happy debugging... do a code review.
Options
- Mark as New
- Bookmark
- Subscribe
- Mute
- Subscribe to RSS Feed
- Permalink
- Email to a Friend
- Report Inappropriate Content
2024-03-19 2:08 AM
I always try to find the root cause, but sometimes its hard. When the problem dissapears without knowing why, it is the worst thing for me. My RAM is only 7% used. I do not use malloc (at least in my code).
I had some minor warnings, that i cleaned up. I also tried another hardware, which brings the same error.
Options
- Mark as New
- Bookmark
- Subscribe
- Mute
- Subscribe to RSS Feed
- Permalink
- Email to a Friend
- Report Inappropriate Content
2024-03-19 2:19 AM
Code Review!
Go over your code and verify if all is reasonable, e.g. right size of buffers, right length when using it, enough stack size allocated...
Check also for different types used, esp. when it comes to "casting". Example:
uint8_t b[10];
void f(uint32_t *b, int i)
{
   while(i--)
      *b++ = i;
}

void main(void)
{
  f((uint32_t *)b, 10);
}
This is for sure a bug! You write way beyond the allocated memory for b[]! This code will corrupt memory (silently) and something very strange can happen.
Options
- Mark as New
- Bookmark
- Subscribe
- Mute
- Subscribe to RSS Feed
- Permalink
- Email to a Friend
- Report Inappropriate Content
2024-03-19 4:21 AM - edited 2024-03-19 4:34 AM
I think i found the culprit:
When i turned off optimizations, there were no more debugging problems, and my program runs fine!
I have checked again:
There is not program code executed befor this problem! In main i only jump into function setup, where debbuging problems are visible!
Here the code where the debugging problems happen:
//Test crosstalk PWMlines
GPIO_InitTypeDef GPIO_InitStruct = {0};
GPIO_InitStruct.Pin = GPIO_PIN_12;
GPIO_InitStruct.Mode = GPIO_MODE_OUTPUT_PP;
GPIO_InitStruct.Pull = GPIO_NOPULL;
GPIO_InitStruct.Speed = GPIO_SPEED_FREQ_LOW;
HAL_GPIO_Init(GPIOC, &GPIO_InitStruct);
GPIO_InitStruct.Pin = GPIO_PIN_8;
GPIO_InitStruct.Mode = GPIO_MODE_OUTPUT_PP;
GPIO_InitStruct.Pull = GPIO_NOPULL;
GPIO_InitStruct.Speed = GPIO_SPEED_FREQ_LOW;
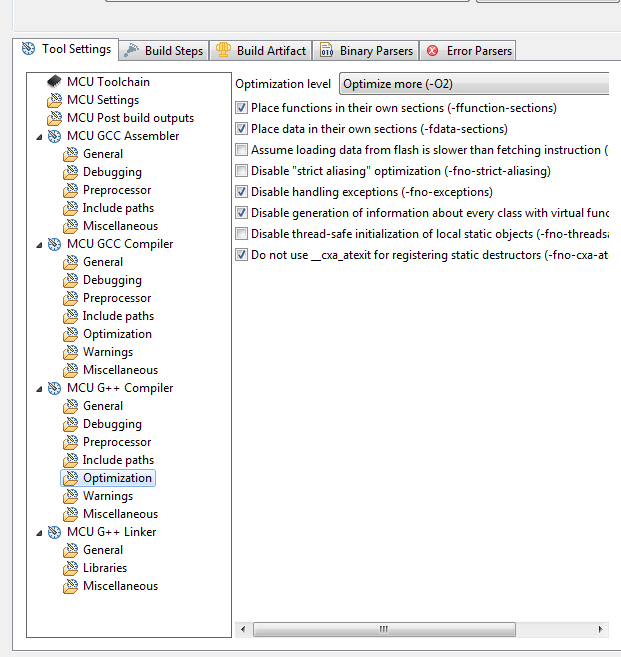
HAL_GPIO_Init(GPIOC, &GPIO_InitStruct);See the picture:
For GCC, there are the same first two options (checkboxes) set.
Options
- Mark as New
- Bookmark
- Subscribe
- Mute
- Subscribe to RSS Feed
- Permalink
- Email to a Friend
- Report Inappropriate Content
2024-03-19 4:51 AM
I have now confirmed, that a brand new project has the same issue! Its happening, when you turn on optimization level 2!
Options
- Mark as New
- Bookmark
- Subscribe
- Mute
- Subscribe to RSS Feed
- Permalink
- Email to a Friend
- Report Inappropriate Content
2024-03-19 5:01 AM
It is in the nature of optimisation to make debugging more difficult.
But optimisation shouldn't cause execution errors - when that happens, it's (almost) always down to incorrect code ...
A complex system that works is invariably found to have evolved from a simple system that worked.
A complex system designed from scratch never works and cannot be patched up to make it work.
A complex system designed from scratch never works and cannot be patched up to make it work.
Options
- Mark as New
- Bookmark
- Subscribe
- Mute
- Subscribe to RSS Feed
- Permalink
- Email to a Friend
- Report Inappropriate Content
2024-03-19 7:12 AM
So optimizations do change execution times, dont they?
Options
- Mark as New
- Bookmark
- Subscribe
- Mute
- Subscribe to RSS Feed
- Permalink
- Email to a Friend
- Report Inappropriate Content
2024-03-19 7:14 AM
Of course - one of the key reasons to optimise is for speed !
(another is for code size - which is also likely to affect timings)
A complex system that works is invariably found to have evolved from a simple system that worked.
A complex system designed from scratch never works and cannot be patched up to make it work.
A complex system designed from scratch never works and cannot be patched up to make it work.
Options
- Mark as New
- Bookmark
- Subscribe
- Mute
- Subscribe to RSS Feed
- Permalink
- Email to a Friend
- Report Inappropriate Content
2024-03-19 9:27 AM
With optimization debugging becomes impossible: I run in debug usually with -g and -Og. -g and -O2 together can be not enough info for debugger generated.
I had one project where optimization level -O3 was not notworking. The reason was: some volatile forgotten to use. If your code fails with higher optimization - something wrong in the code (do a code review). If just on one place where a volatile is needed (to avoid optimization), because this variable should be read all the time again, e.g. in a loop, e.g. when reading registers in MCU.
Ty to check your code if a volatile is missing (e.g. also used to inform from INT the main thread, and INT was there).
You can also encapsulate via #pragma some pieces of code or a function where you might guess there could be an "optimization issue".
I was able to fix my code so that it runs also with -O3.
Related Content
- Object initialization silently skipped with picolibc due to missing linker symbols in STM32CubeIDE for Visual Studio Code (MCUs)
- Multi Core Debug Problem, Single Core Debug OK in STM32CubeIDE (MCUs)
- vscode + STM32CubeIDE, debug, but 'optimized out' in STM32CubeIDE for Visual Studio Code (MCUs)
- STM32CubeProgrammer v2.21 breaks External Loader in STM32CubeProgrammer (MCUs)
- Error with CMake in New Version 6.15.0 in STM32CubeMX (MCUs)