- STMicroelectronics Community
- STM32 MCUs
- STM32 MCUs Products
- Re: Lan8742 Hardfault
- Subscribe to RSS Feed
- Mark Topic as New
- Mark Topic as Read
- Float this Topic for Current User
- Bookmark
- Subscribe
- Mute
- Printer Friendly Page
Lan8742 Hardfault
- Mark as New
- Bookmark
- Subscribe
- Mute
- Subscribe to RSS Feed
- Permalink
- Email to a Friend
- Report Inappropriate Content
2023-09-27 06:16 PM
Stats:
STM32CubeIDE
Version: 1.13.2
Build: 18220_20230914_1601 (UTC)
Windows 10 Enterprise
I have a project using STM32H743 and Azure RTOS, ThreadX, NetX, and FileX.
In the NetX portion during initialization of the netx thread, the code performs initiation of the LAN8742 device.
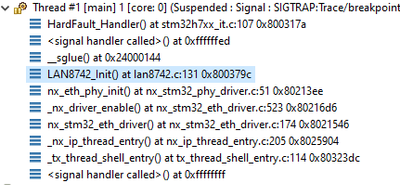
Here is the call stack tree in the debugger:

The hard fault occurs on line 131 in the lan8742.c code which is :
if(pObj->IO.WriteReg(pObj->DevAddr, LAN8742_BCR, LAN8742_BCR_SOFT_RESET) >= 0)
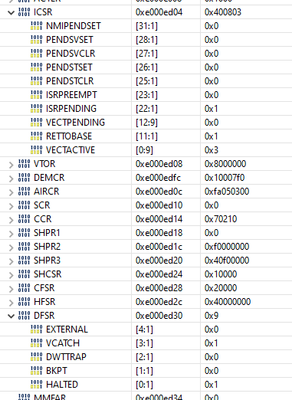
The Status registers show:

The fault is 100% repeatable.
The fault appeared after adding some code to a completely unrelated section
and the fault happens prior to any of the added code being executed. As far as I can tell
The only difference is that the added code has pushed the LAN8742.c code a
little farther down in the flash. I also noticed that some of the printf()'s for debug also
cause issues like mem faults and have to be commented out. I am not finished experimentation
with what causes the hard fault in the Lan8742 code but any comments at this pint are welcome.
Solved! Go to Solution.
- Labels:
-
STM32H7 Series
Accepted Solutions
- Mark as New
- Bookmark
- Subscribe
- Mute
- Subscribe to RSS Feed
- Permalink
- Email to a Friend
- Report Inappropriate Content
2023-10-03 03:49 PM
This is true, but in this case not much help or at least not much different than inspecting the stack and the fault registers. But as it turns out the error always occurs on the same statement which was a strtok call. Further research shows the strtok call to not be thread safe. strtok_r() is and it works. The faults are not occurring anymore.
- Mark as New
- Bookmark
- Subscribe
- Mute
- Subscribe to RSS Feed
- Permalink
- Email to a Friend
- Report Inappropriate Content
2023-09-28 06:20 AM
Look at the hard fault registers in order to determine the cause of the hard fault.
Your line of code uses a lot of data within structures. Verify the data within those structures is valid at the time of the call.
- Mark as New
- Bookmark
- Subscribe
- Mute
- Subscribe to RSS Feed
- Permalink
- Email to a Friend
- Report Inappropriate Content
2023-09-28 09:36 AM
Can you retest with cache disabled ?
- Mark as New
- Bookmark
- Subscribe
- Mute
- Subscribe to RSS Feed
- Permalink
- Email to a Friend
- Report Inappropriate Content
2023-09-28 10:18 AM
The screen shots presented in the original post are the hard fault registers?
- Mark as New
- Bookmark
- Subscribe
- Mute
- Subscribe to RSS Feed
- Permalink
- Email to a Friend
- Report Inappropriate Content
2023-09-28 10:22 AM
This morning the hard fault is no longer occurring. Gremlins? If the problem re-appears I will try disabling cache.
- Mark as New
- Bookmark
- Subscribe
- Mute
- Subscribe to RSS Feed
- Permalink
- Email to a Friend
- Report Inappropriate Content
2023-09-28 10:48 AM
I am noticing that the printf statements end up passing a pointer that references ram (i.e. 0x240029eB). I would have expected the string in the printf to be in ROM space. But what happens if the function crosses 32 byte boundaries? Should not be an issue since the function operates at the byte level.
Past experience indicates the code is sensitive to placement as new code is added it makes or breaks execution. Odd!
- Mark as New
- Bookmark
- Subscribe
- Mute
- Subscribe to RSS Feed
- Permalink
- Email to a Friend
- Report Inappropriate Content
2023-09-28 11:27 AM
Yeah, I don't know how I missed them. Sorry about that.
If printf causes issues, it is very likely to be a heap overflow as the default implementation uses the heap, especially as the problem is sensitive to subtle code changes. Perhaps the thread is overflowing its allocation. Try increasing the amount. I would hope that allocation in AzureOS is thread-safe, but I'm not an expert there.
- Mark as New
- Bookmark
- Subscribe
- Mute
- Subscribe to RSS Feed
- Permalink
- Email to a Friend
- Report Inappropriate Content
2023-09-28 12:03 PM
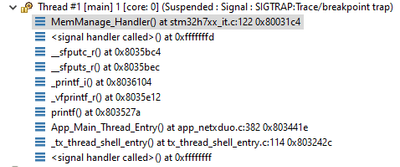
I kept adding printf statements until the error occurred again. This time it ends up in the mem_manage handler. The fault repeats on every run. Commenting out the Cache Enables for I and D, one at a time, and then both, does not change the location of the error or error type. The call stack is always:
Lacking patience for this I guess I am going to make my own terminal debug functions and put them in a thread. Hopefully it will be a little behaved.
- Mark as New
- Bookmark
- Subscribe
- Mute
- Subscribe to RSS Feed
- Permalink
- Email to a Friend
- Report Inappropriate Content
2023-09-28 03:19 PM - edited 2023-09-28 03:27 PM
I made my own debug print routing in a task using HAL_UART_Transmit_DMA. The faults keep happening. If the DMA is busy I sleep the thread. The faults still occur; sometimes hard , sometimes memory. I turned my attention to how long the debug had to sleep and was quite astonished. So I though there maybe some contention between priorities and operation with the threads. Most of the priorities are 10. I dropped the priority of the debug thread to 15 and raised the priority of the network threads to 9.
No more faults.
So far.
- Mark as New
- Bookmark
- Subscribe
- Mute
- Subscribe to RSS Feed
- Permalink
- Email to a Friend
- Report Inappropriate Content
2023-09-28 07:10 PM
CubeIDE debugger has the fault analyzer tool. It is there for you, please use it to understand why the faults occur.
- End Device HardFault after switching to ClassC in STM32 MCUs Wireless
- Flashing issue using Zephyr & STLink in STM32 MCUs Products
- Hard fault after activating network interfaces in STM32 MCUs Embedded software
- nucleo-f439zi USB from Scratch falling into Hardfault in STM32 MCUs Embedded software
- Hard Fault in USBH_MSC_RdWrProcess() and USBH_MSC_GetLUNInfo() in STM32 MCUs Embedded software
