- STMicroelectronics Community
- STM32 MCUs Software development tools
- STM32CubeMX (MCUs)
- Re: Effect of CubeMX DEBUG Settings
- Subscribe to RSS Feed
- Mark Topic as New
- Mark Topic as Read
- Float this Topic for Current User
- Bookmark
- Subscribe
- Mute
- Printer Friendly Page
Effect of CubeMX DEBUG Settings
- Mark as New
- Bookmark
- Subscribe
- Mute
- Subscribe to RSS Feed
- Permalink
- Email to a Friend
- Report Inappropriate Content
2024-03-07 11:09 PM - edited 2024-03-07 11:10 PM
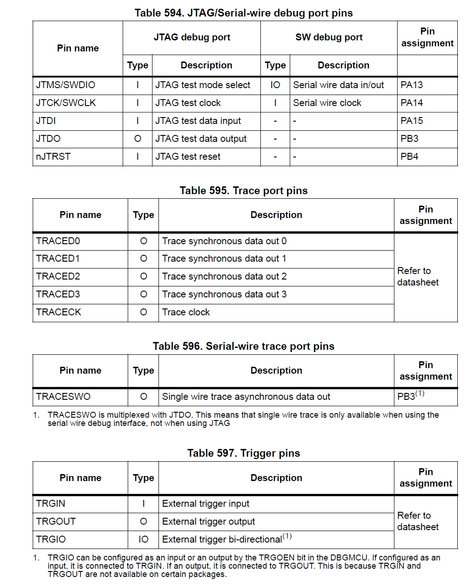
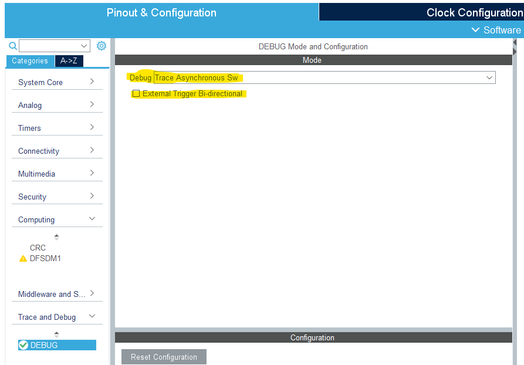
Other than reserving pins for the hardware-implemented debug interface (Fig. 1), what are the effects of the highlighted settings of the "Trace and Debug" category of CubeMX (Fig. 2)?
Fig 1: Debug infrastructure (RM0433)
Fig 2: CubeMX Trace and Debug
Changing those settings has no effect in regard of code generation.
How would one utilize i.e. External Trigger Bi-directional? I would have expected the system to halt (essentially triggering a breakpoint) on a signal change of the reserved TRGIO pin when activating this setting - but nothing happens. The same is true for the other direction, triggering a breakpoint does not change the value on the TRGIO pin.
The same goes for the setting Trace Synchro SW (x bits). SWDIO and SWCLK can be used to communicate with a debugger, but TraceD0 seems to do nothing?
I could not find an answer in the datasheet as referenced by Table 595 in RM0433.
Solved! Go to Solution.
- Labels:
-
STM32H7 Series
Accepted Solutions
- Mark as New
- Bookmark
- Subscribe
- Mute
- Subscribe to RSS Feed
- Permalink
- Email to a Friend
- Report Inappropriate Content
2024-03-11 6:51 AM
> How would one activate the External Trigger Bi-directional for example? Or the synchronous tracing?
One instructs the debugger (or other software) to connect to the target in desired mode. For example to use ITM trace, you check the box in the debugger dialog and select SWD mode (not JTAG). The debugger then configures the debug module of the target MCU.
- Mark as New
- Bookmark
- Subscribe
- Mute
- Subscribe to RSS Feed
- Permalink
- Email to a Friend
- Report Inappropriate Content
2024-03-09 2:08 PM - edited 2024-03-09 2:11 PM
Selection of debug mode in CubeMX/IDE does not have other effects besides of reserving the pins (which is already valuable).
Activation of the debug mode is what matters. This occurs when the debugger connects to STM32 or the program running on STM32 pokes the DBG module and related things (cross-trigger interface, ETM, ITM, trace...)
- Mark as New
- Bookmark
- Subscribe
- Mute
- Subscribe to RSS Feed
- Permalink
- Email to a Friend
- Report Inappropriate Content
2024-03-11 12:57 AM
@Pavel A.Thank you.
How would one activate the External Trigger Bi-directional for example? Or the synchronous tracing? Is this the responsibility of the debugger hardware/tool?
SWD is straight forward since it is the default(?) debug interface and used by the ST-Link debugger.
- Mark as New
- Bookmark
- Subscribe
- Mute
- Subscribe to RSS Feed
- Permalink
- Email to a Friend
- Report Inappropriate Content
2024-03-11 6:51 AM
> How would one activate the External Trigger Bi-directional for example? Or the synchronous tracing?
One instructs the debugger (or other software) to connect to the target in desired mode. For example to use ITM trace, you check the box in the debugger dialog and select SWD mode (not JTAG). The debugger then configures the debug module of the target MCU.
- Example via CubeIDE is OK, but same via MX is not (STM32C0, Ux_Host_HID_Standalone) in STM32CubeMX (MCUs)
- Impact of Clock Stretching and Applicability of Slave Features in STM32CubeIDE in STM32CubeIDE (MCUs)
- SMPS on the STM32H747XI in STM32CubeMX (MCUs)
- Error: Region Flash of context Boot and region Flash of context Appli are overlapped. in STM32CubeMX (MCUs)
- JLink GDB Server can not run in STM32CubeIDE for STM32WLE5xx in STM32CubeIDE (MCUs)

