STM32CubeIDE - SWV Profiling
- Mark as New
- Bookmark
- Subscribe
- Mute
- Subscribe to RSS Feed
- Permalink
- Email to a Friend
- Report Inappropriate Content
2023-07-20 7:23 PM
Hi,
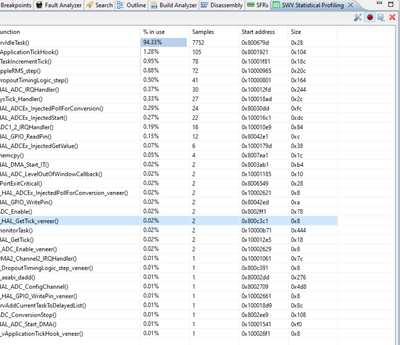
I use the SWV Profiling tool quite a lot towards the end of my projects to "fine tune" the speed and efficiency of my code. i.e. what code to run from ram, whether to use cacheing, find inefficient algorithms etc.
It would be handy to export the Profile window to excel or some other similar tool to compare runs with different configurations.
Does anyone know if this is possible.
Regards
Rob
Solved! Go to Solution.
- Labels:
-
eDesignSuite
Accepted Solutions
- Mark as New
- Bookmark
- Subscribe
- Mute
- Subscribe to RSS Feed
- Permalink
- Email to a Friend
- Report Inappropriate Content
2023-07-21 5:52 AM
Hello @Garnett.Robert ,
During an active debugging session, all functions that are in use, can be exported only as txt file from the SWV Statistical Profiling view.
Regards,
Rim
- Mark as New
- Bookmark
- Subscribe
- Mute
- Subscribe to RSS Feed
- Permalink
- Email to a Friend
- Report Inappropriate Content
2023-07-24 6:42 PM
Hi Rim
Thanks for that. I was right clicking looking for a context menu. I didn't see the floppy disk Icon as I'm using a large hi-res screen and the icon is very small. My eyes are getting old as well and I have trouble with depth of field.
Best regards
Rob
