- STMicroelectronics Community
- STM32 MCUs
- STM32 MCUs Products
- J-Trace Pro connect and download error with STM32L...
- Subscribe to RSS Feed
- Mark Topic as New
- Mark Topic as Read
- Float this Topic for Current User
- Bookmark
- Subscribe
- Mute
- Printer Friendly Page
J-Trace Pro connect and download error with STM32L552E-EV board
- Mark as New
- Bookmark
- Subscribe
- Mute
- Subscribe to RSS Feed
- Permalink
- Email to a Friend
- Report Inappropriate Content
2020-09-01 1:05 PM
Hello,
I’m learning embedded development with a J-Trace Pro and an STM32L552E-EV board. After downloading the trace demo project from the segger wiki, I try to debug it with Segger Embedded Studio and Ozone.
Here is the board information.
https://www.st.com/en/evaluation-tools/stm32l552e-ev.html
Here is the demo trace project wiki.
https://wiki.segger.com/Tracing_on_ST_STM32L552
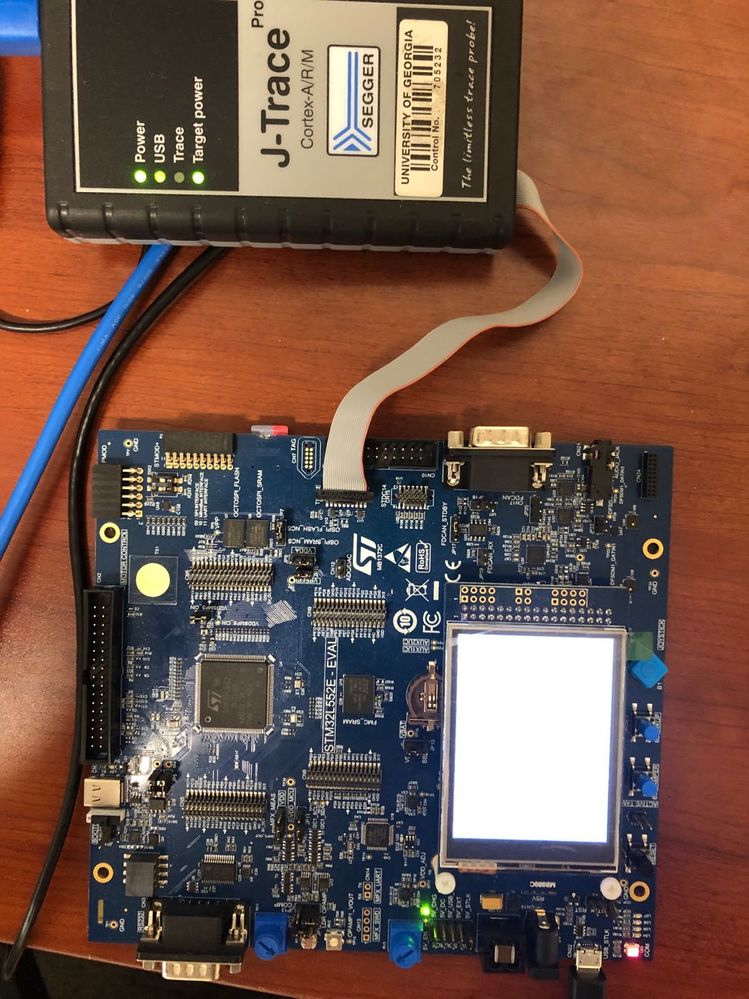
The attach is how I connect J-Trace Pro with the board.
However, when click the debug button, the panel shows the error information:
Disabled output of control charactersJ-Link software found at:
Target core support plugin loaded.: /opt/SEGGER/ozone/3.20.3/Plugins/Core/CorePluginARM.so
Project.SetDevice ("STM32L552ZE");
Project.SetHostIF ("USB", "");
Project.SetTargetIF ("SWD");
Project.SetTIFSpeed ("4000");
Project.AddSvdFile ("$(InstallDir)/Config/CPU/Cortex-M33F.svd");
File path resolved: "$(InstallDir)/Config/CPU/Cortex-M33F.svd" was found at "/opt/SEGGER/ozone/3.20.3/Config/CPU/Cortex-M33F.svd"
File.Open ("/home/lwq/Downloads/ST_STM32L552_Trace_Example/Output/Debug/Exe/ST_STM32L552_Trace_Example.elf");
File.Open: completed in 20 ms
Debug.ReadIntoInstCache: updated instruction information within 2 code ranges (0x08000000-0x080002D2)
Tools.TraceSettings();
Project.SetTraceSource ("Trace Pins");
Debug.Start();
Device "STM32L552ZE" selected.
Found SW-DP with ID 0x0BE12477
DPIDR: 0x0BE12477
Scanning AP map to find all available APs
AP[1]: Stopped AP scan as end of AP map has been reached
AP[0]: AHB-AP (IDR: 0x14770015)
Iterating through AP map to find AHB-AP to use
AP[0]: Core found
AP[0]: AHB-AP ROM base: 0xE00FE000
CPUID register: 0x410FD212. Implementer code: 0x41 (ARM)
Found Cortex-M33 r0p2, Little endian.
FPUnit: 8 code (BP) slots and 0 literal slots
Security extension: implemented
Secure debug: enabled
CoreSight components:
ROMTbl[0] @ E00FE000
ROMTbl[0][0]: E00FF000, CID: B105100D, PID: 000BB4C9 ROM Table
ROMTbl[1] @ E00FF000
ROMTbl[1][0]: E000E000, CID: B105900D, PID: 000BBD21 Cortex-M33
ROMTbl[1][1]: E0001000, CID: B105900D, PID: 000BBD21 DWT
ROMTbl[1][2]: E0002000, CID: B105900D, PID: 000BBD21 FPB
ROMTbl[1][3]: E0000000, CID: B105900D, PID: 000BBD21 ITM
ROMTbl[1][5]: E0041000, CID: B105900D, PID: 002BBD21 ETM
ROMTbl[1][6]: E0042000, CID: B105900D, PID: 000BBD21 CTI
ROMTbl[0][1]: E0040000, CID: B105900D, PID: 000BBD21 Cortex-M33
Connected to target device.
Reset: Halt core after reset via DEMCR.VC_CORERESET.
Reset: Reset device via AIRCR.SYSRESETREQ.
Elf.GetBaseAddr(); // returns 0x8000000
Target.ReadU32 (0x08000000); // returns 0x20030000
Target.SetReg ("SP", 0x20030000);
Elf.GetEntryPointPC(); // returns 0x800021E
Target.SetReg ("PC", 0x800021E);
Failed to erase sectors 0 @ address 0x08000000 (Unknown algo: Unspecified error #1)
Failed to erase sectors.
Download failed: J-Link reports an unspecified download error
Could you please help to figure out the problem?
Besides, when I try to config and use Jtrace pro with STM32CubeIDE, it also doesn't work. Could you please share a tutorial to config to use J-Trace/J-Link inside the STM32CubeIDE?
Thanks.
- Labels:
-
DEBUG
-
STM32L5 Series
- Mark as New
- Bookmark
- Subscribe
- Mute
- Subscribe to RSS Feed
- Permalink
- Email to a Friend
- Report Inappropriate Content
2020-09-01 1:26 PM
Perhaps pick an option where it doesn't try to download the code when you haven't specified a flash loader/algorithm for the STM32L5
Check that you have the solder bridges/resistors configured to permit trace. Can't use trace concurrent with SD Card.
Hopefully it doesn't need an ODD address for the PC
>>Could you please share a tutorial to config to use J-Trace/J-Link inside the STM32CubeIDE?
CubeIDE, L5, J-Trace probably a bit too specific/narrow. Find something close/general and triangulate.
Up vote any posts that you find helpful, it shows what's working..
- Genuine STLINK-V3MINIE doesn't work, but clone STLINK-V2 works in STM32 MCUs Boards and hardware tools
- Output log showing HWrst mode while it's connected over DFU mode in STM32CubeProgrammer (MCUs)
- STM32CubeProgrammer v2.19.0 USB DFU does not complete the connection in STM32CubeProgrammer (MCUs)
- STM32H573 stuck in Standby mode with 5 sec IWDG timeout in STM32 MCUs Embedded software
- Bricked two STM32WBA55 NUCLEO boards by flashing in CubeIDE (repeteable) in STM32 MCUs Products
