- STMicroelectronics Community
- STM32 MCUs
- STM32 MCUs Products
- Re: Breakpoints suddenly stopped working
- Subscribe to RSS Feed
- Mark Topic as New
- Mark Topic as Read
- Float this Topic for Current User
- Bookmark
- Subscribe
- Mute
- Printer Friendly Page
Breakpoints suddenly stopped working
- Mark as New
- Bookmark
- Subscribe
- Mute
- Subscribe to RSS Feed
- Permalink
- Email to a Friend
- Report Inappropriate Content
2022-06-22 08:37 AM
I'm using Atollic TrueStudio 9.3.0. I know it's not the latest, but now is not the time to change anything.
I've been debugging my custom boards no problem, for years, including setting at stopping at breakpoints. All of a sudden this morning, the debugger no longer stops at breakpoints. I am not aware of anything changing. I power cycled the target board, the ST-LINK/V2, and my host computer, but the problem remains. I recompiled the whole program (Rebuild), but the problem remains.
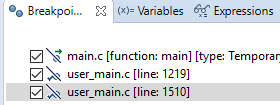
Please see the image below. Notice how the icons to the right of the checkboxes appear to have a slash through them. THIS IS NEW! I've never seen it before and I don't know what it means. The same slash appears through the breakpoint icon whenever I set (toggle on) a breakpoint from the source code, whether I'm currently debugging or not. If I knew what this slash meant, it might help me figure out what has gone wrong. I haven't been able to find any doc on it. Of course, I figure the sudden appearance of the slash through the breakpoint icons is correlated with the sudden fact that the debugger no longer stops at breakpoints.

Thanks in advance for your help.
- Labels:
-
DEBUG
-
TrueSTUDIO
- Mark as New
- Bookmark
- Subscribe
- Mute
- Subscribe to RSS Feed
- Permalink
- Email to a Friend
- Report Inappropriate Content
2022-06-22 09:41 AM
https://stackoverflow.com/questions/4388192/eclipse-doesnt-stop-at-breakpoints ?
Don't know, hate eclipse, don't touch it, just googled.
JW
- Mark as New
- Bookmark
- Subscribe
- Mute
- Subscribe to RSS Feed
- Permalink
- Email to a Friend
- Report Inappropriate Content
2022-06-22 10:52 AM
OMGMF! I've never seen that in a debug GUI. So this GUI has *both* "disable" breakpoints and "skip" breakpoints. Weird. I figured it was something stupid. I found the "skip all breakpoints" icon and unclicked it. It must have gotten hit by mistake.
Working now. Thanks @Community member
- STM32H723 - SPI stop working randomnly in STM32 MCUs Products
- Can't Get Blinky Project working With FreeRTOS in STM32 MCUs Embedded software
- Unexpected Behavior in RCC->CSR Register and Processor Exit from While Loop (STM32F765VGT6) in STM32 MCUs Products
- STM32 internal RTC backup registers getting cleared even if there is Vbat connected. in STM32 MCUs Products
- STM32H7B3I-EVAL and M2 macOS, new to STM, Example project does not run in STM32CubeIDE (MCUs)