- STMicroelectronics Community
- STM32 MCUs Software development tools
- STM32CubeMonitor (MCUs)
- Re: How to watch an array using STM32CubeMonitor?
- Subscribe to RSS Feed
- Mark Topic as New
- Mark Topic as Read
- Float this Topic for Current User
- Bookmark
- Subscribe
- Mute
- Printer Friendly Page
How to watch an array using STM32CubeMonitor?
- Mark as New
- Bookmark
- Subscribe
- Mute
- Subscribe to RSS Feed
- Permalink
- Email to a Friend
- Report Inappropriate Content
2020-12-09 10:19 AM
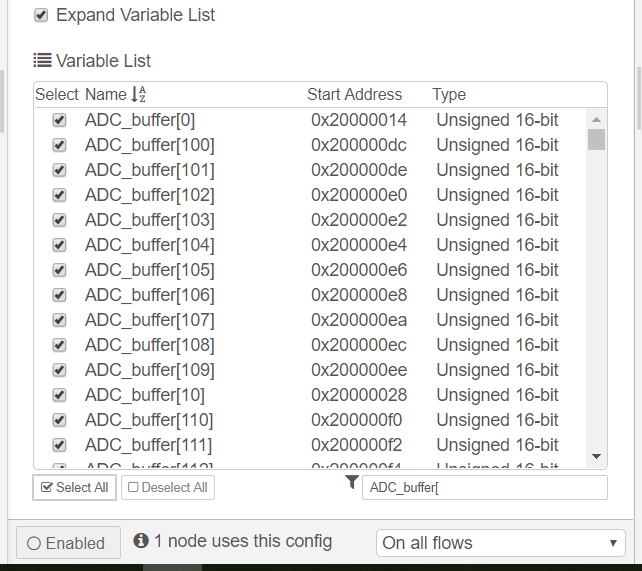
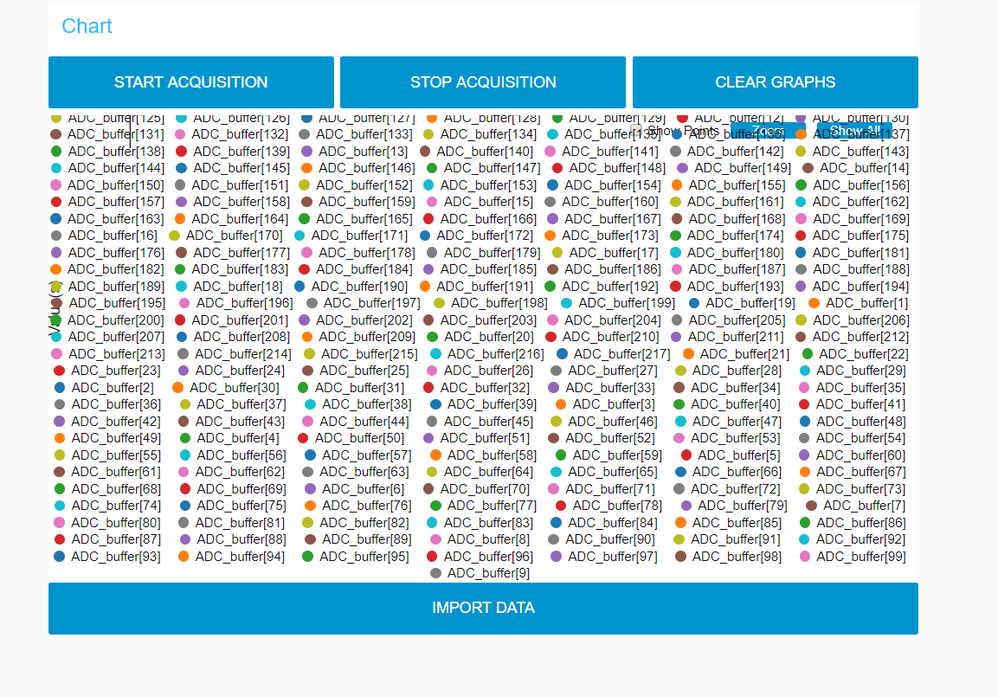
How should I configure STM32CubeMonitor to watch the flow of an array? I can either select the first position or expand the array but then the graph will be a mess. See below.
Solved! Go to Solution.
- Labels:
-
STM32CubeMonitor
Accepted Solutions
- Mark as New
- Bookmark
- Subscribe
- Mute
- Subscribe to RSS Feed
- Permalink
- Email to a Friend
- Report Inappropriate Content
2021-09-20 12:43 AM - edited 2024-03-05 5:37 PM
Update 2024 If download links are broken, check attachments below this message (*.7z archive).
Update 2023 (STM32CubeMonitor 1.6.0) Watching multiple 1D arrays + better code:
New version available (cubearrays v1.0)! Now all arrays are automatically parsed and stored in global variables. Step-by-step instructions:
- Download cubearrays here: nodes10.zip (use nodes from "cubearrays" directory)
- Open STM32CubeMonitor, find three stripes / hamburger in up-right corner and press it to open menu → Import
- In "Import nodes" windows select "Local" → STM32CubeMonitor_BasicFlow.json → press Import button
- Delete "show notification", "myChart" and "Clear Graphs" nodes
- Three stripes / hamurger → Import → Clipboard tab → "select a file to import" button → find and select cubearrays10.json → Import button
- Connect variables node upper output to "CubeArrays v1.0" function input node
- Double-click "CubeArrays v1.0" function node, select "On Message" tab, scroll down to const arrayNames=["arrayName1","arrayName2",...
- Replace "arrayName1", "arrayName2" by actual array names put in quotes (case sensitive!)
- Double-click Chart #1, write first array element count in "OR points" field
- If you added Chart node by yourself, set "Set X-axis Label" to "custom" and enter "x"
- Set Y-axis min and max values according to your requirements. For uint8_t it would be min: 0, max: 255
- Configure Chart #2 and Chart 3 in the same manner
- Double-click myProbe_Out node, select your STLink probe. If list is empty, press pencil button, select your ST-Link, write some Name, press "Add" button → "Done"
- Double-click myProbe_In node, select your ST-Link probe → "Done"
- Compile your project, find debug directory with ELF file
- Double-click "myVariables" node → Pencil button near "Executable"
- Paste ELF file folder path to "Folder" field → Press "File" drop-down list and select your project .elf file
- Press "Expand Variable List" → write first array name in lower-right "filter" field and press "Select All" button
- Select all elements of second and third array using same approach: write name in filter → press "Select All"
- Write some text in "Name" field, this will enable "Add" button
- After pressing "Add" button large arrays cause significant delay before STM32CubeMonitor user interface become responsive
- Press Deploy button → Dashboard button → in opened window START ACQUISTION button
- Correct chart configurations if some graphs are out of scale
Example using cubearray10.json in STM32CubeMonitor v1.6.0:
Three arrays - https://youtu.be/_tnx1ZxkiY8
Old version:
Just tried in latest version (1.2.0), please check this short explanatory video https://youtu.be/VAxnharGr_M
Note that script is written in previous version, probably 1.1.0 and worked without a problem too. It turns out I wrote it in 1.2.0. Some steps of explanatory video:
- Top right corner menu button → Import → Library → Stm32CubeMonitor_BasicFlow.json
- Deleted previous unused tab "Basic_Flow"
- Top right corner menu button → Import → Clipboard → "select a file to import" → sigview2.json
- "Some of nodes you are importing already exist in your workspace" → Import copy
- Delete "Mychart" and "Clear Graphs" nodes by selecting them using mouse right-click and pressing "Del" on keyboard
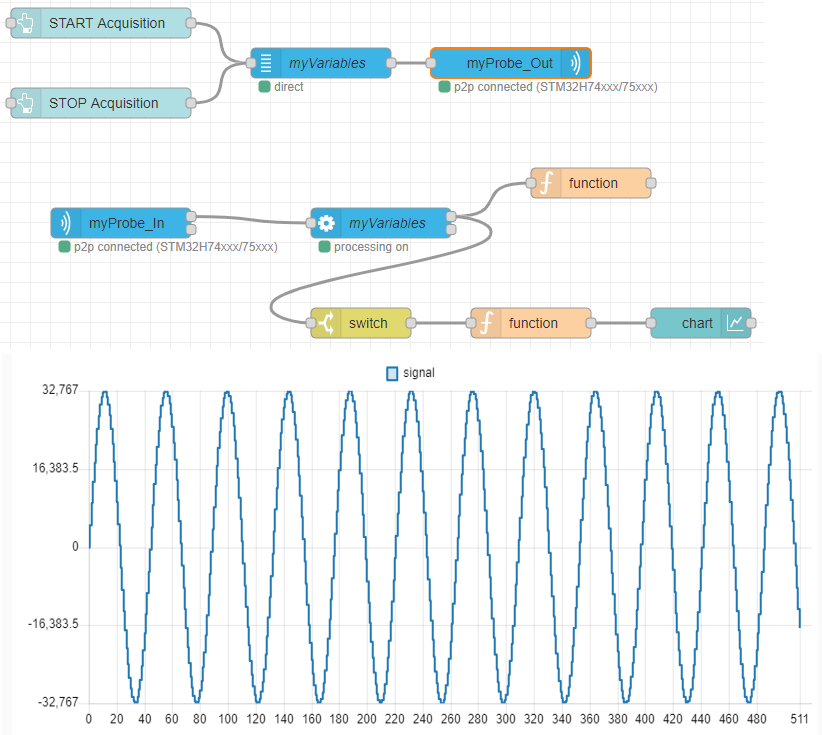
- Connect "myVariables" node output to newly imported "function" and "switch" nodes as shown on screenshot/in video
- Select ST-link in "myProbe_Out" and "myProbe_In" nodes
- In upper "myVariables" node press "Add new exe-config..." → select path to *.ELF in your project directory
- Set checkbox "expand Variable List" to expand array elements to separate variables
- In filter textfield write "testBuffer" (case sensitive)
- Press "Select All" button to select all elements of testBuffer[0],testBuffer[1],testBuffer[2],... array
- Put some name for executable in "Name" textfield, so "Add" button will become available, press "Add" button
- Update 2021: double-click "switch" and change name to mach name in your source code / axf file. If your array is named someArray, then you put here someArray[9]. "9" index is used because of alphabetical sorting it is the last array element during readout for 1024 elements. You can see it in "variables"
- Press "DEPLOY" button
- Press "DASHBOARD" button → in new window press "START ACQUISTION"
- You can see array is displayed correctly as sine graph.
Most important steps: select ST_Link, import Stm32CubeMonitor_BasicFlow.json example and combine it with sigview2.json. Add all array elements as separate variables to the list. If array name and size in your code matches testBuffer in Node-RED script, then everything must work after pressing deploy→dashboard→start.
Update 2021: watching array with different name/size
Assume we have an array ADC_BUFF1 with values ranging from -1 to +1
float32_t ADC_BUFF1[256];
//...
for (int i=0; i<256; i++)
{
	ADC_BUFF1[i]=sin(2.0*M_PI/256*i);
}
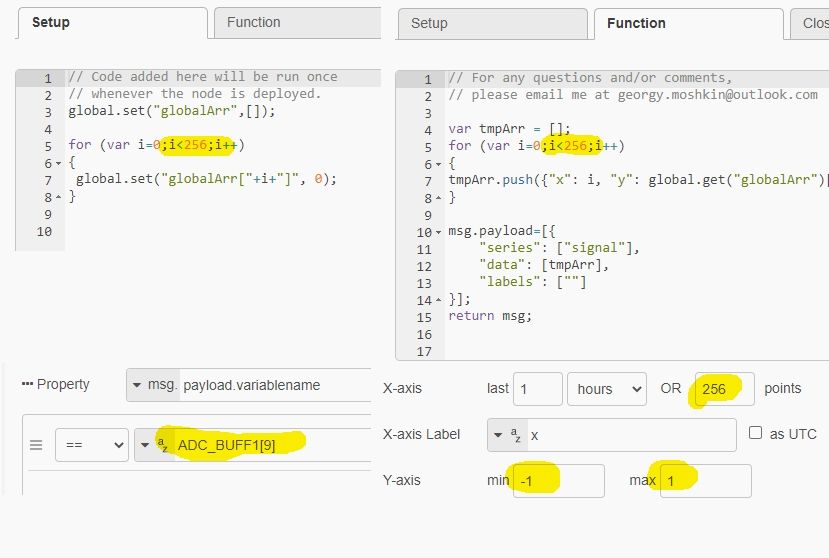
To make it work
- double-click first function
- open setup tab
- replace 1024 with 256 in for (var i=0;i<256;i++)
- double-click "switch"
- replace text with ADC_BUFF1[9]
- double-click "chart"
- replace 1024 with 256, set Y-axis min/max to -1 1
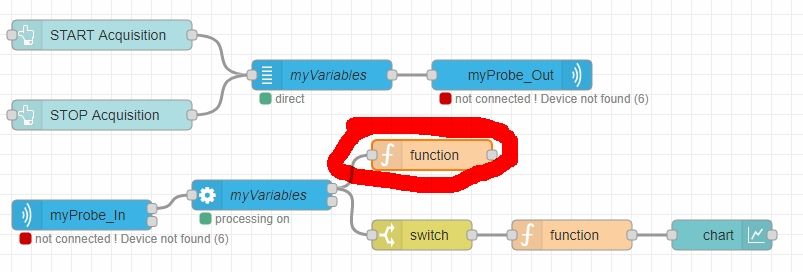
I see that Setup and Close tabs are missing on your screenshot, I do not know why. Those tabs are common for function nodes in Node-RED, for example:
https://discourse.nodered.org/t/setup-in-a-function-node/39445
What happens if you put empty function node and double-click on it? Still no Setup/Close tabs?
- Mark as New
- Bookmark
- Subscribe
- Mute
- Subscribe to RSS Feed
- Permalink
- Email to a Friend
- Report Inappropriate Content
2020-12-11 1:45 AM
Hello
The graph has not been designed to display arrays with so many entries. I guess you don't want to have one hundred of curves in one chart.
There should be some better options with node-RED.
- How many data do you have in the array ?
- How do you want to display it ? All values should make one curve in a chart or in a table ?
- Does the values evolves in real time ?
Best regards
Stephane
- Mark as New
- Bookmark
- Subscribe
- Mute
- Subscribe to RSS Feed
- Permalink
- Email to a Friend
- Report Inappropriate Content
2020-12-11 4:05 AM
Thanks for your response. The array is 220 elements. I would like to have both options, either see them as one curve or in a table. The values do evolve in real time.
- Mark as New
- Bookmark
- Subscribe
- Mute
- Subscribe to RSS Feed
- Permalink
- Email to a Friend
- Report Inappropriate Content
2020-12-14 5:46 AM
Hello
STM32CubeMonitor was not designed to handle array of data. Data are managed as individual elements, and there is no way to group it. The first issue is to select all the symbol, and then the display is not adapted.
There are some workarounds to display the data :
1) Export the data in a file, and convert it to csv file. Then use excel or other tool to analyze it. (see other posts on this topics for details)
2) Reorganize the data to send it to a bar chart. Node-RED chart is able to display a bar chart from data not based on time. Then the array value can be displayed.
Best regards
Stephane
- Mark as New
- Bookmark
- Subscribe
- Mute
- Subscribe to RSS Feed
- Permalink
- Email to a Friend
- Report Inappropriate Content
2020-12-16 1:47 AM
Hello,
You can try to loop trough your buffer and assign each value to a variable then watch this variable in CubeMonitor. It worked fine for me.
Best regards
Jude
- Mark as New
- Bookmark
- Subscribe
- Mute
- Subscribe to RSS Feed
- Permalink
- Email to a Friend
- Report Inappropriate Content
2021-04-08 2:11 AM - edited 2024-02-27 2:23 AM
Here is working example of watching 1D array in STM32CubeMonitor: sigview.zip
after downloading,
1) import sigview2.json file to your flow, add two connections as showed on !view-me!.png image. Fix all the errors, delete unused stuff.
2) Add test array to your buffer as in main.c, build
3) Add array elements to your STM32CubeMonitor configuration with "Expand Variable List" checkbox checked, filter variable name by entering "testBuffer" and press "Select All" button under the list.
Signal array is filled on MCU using:
for(int i=0;i<512;i++) {
     testBuffer[i]=(int16_t)roundf(32767*sinf(2.0*M_PI*1000/44100*i));
}
In STM32CubeMonitor/Node-RED:
function 1:
setup tab: creating global variable globalArr
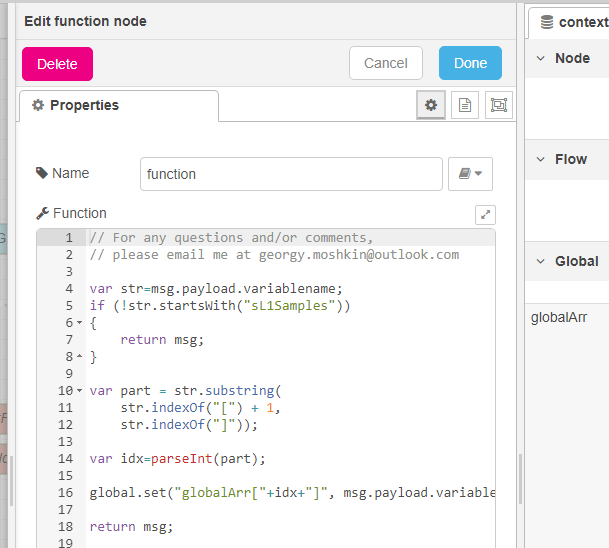
function tab: parsing msg.payload.variablename to get array element index, putting array element to global array
this function gathers single array elements from probe to one global array
global.set("globalArr["+idx+"]", msg.payload.variabledata[0].y);switch:
works only when variable name is "testBuffer[9]" (not testBuffer[511] because of alphabetical order)
function 2:
creates msg.payload for chart only when switch is triggered, so chart is updated only when one full array read out is complete
tmpArr.push({"x": i, "y": global.get("globalArr")[i]});It works pretty well. There may be some errors, started to learn this tool and Node-RED yesterday. It is possible to parse array names and put them on different charts. If somebody improves this please let me know.
- Mark as New
- Bookmark
- Subscribe
- Mute
- Subscribe to RSS Feed
- Permalink
- Email to a Friend
- Report Inappropriate Content
2021-09-19 4:15 PM
@Georgy Moshkin Thanks for this answer. It looks like exactly what I needed.
Unfortunately I have one little problem I cannot solve. The line "global.set("globalArr["+idx+"]", msg.payload.variabledata[0].y);" causes an error "Error: Invalid property expression: unexpected N at position 10". I think this is because I have not defined the global array globalArr. You say "setup tab: creating global variable globalArr". I cant seem to find a place to do this. Can you give more details please?
- Mark as New
- Bookmark
- Subscribe
- Mute
- Subscribe to RSS Feed
- Permalink
- Email to a Friend
- Report Inappropriate Content
2021-09-19 6:08 PM
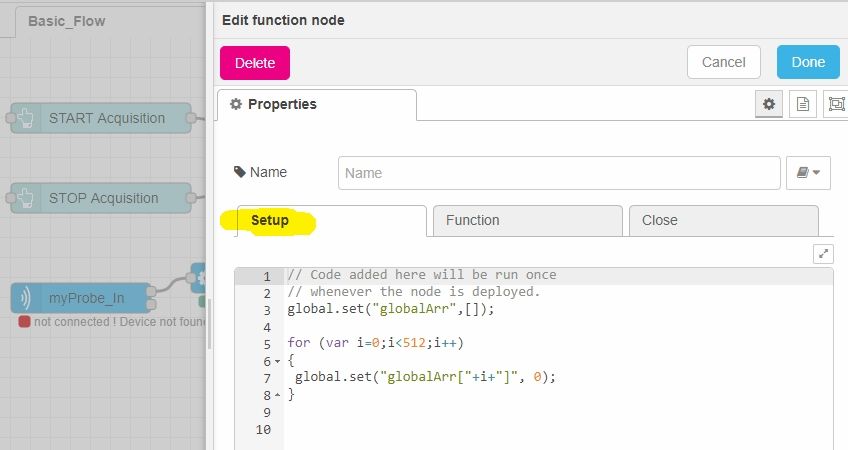
Double click on "f | function" rectangle → "Edit function node" window appear with three tabs in it: "Setup" / "Function" / "Close".
By default second tab is opened "Function" with main source code, you need to open "Setup" tab:
- Mark as New
- Bookmark
- Subscribe
- Mute
- Subscribe to RSS Feed
- Permalink
- Email to a Friend
- Report Inappropriate Content
2021-09-19 8:29 PM
Thanks for the prompt feedback. I do not have the setup tab! I downloaded STM32cubeMonitor V1.1.0 today.
- Mark as New
- Bookmark
- Subscribe
- Mute
- Subscribe to RSS Feed
- Permalink
- Email to a Friend
- Report Inappropriate Content
2021-09-19 8:42 PM
I didn't try new version yet, I'll try it later, hope somebody can comment sooner.
- Sometimes the ADC read ADC1 before ADC0 in Scan Conversion Mode - Why? in STM32CubeMX (MCUs)
- STM32CubeMonitor on Mac not usable in STM32CubeMonitor (MCUs)
- STM32CubeMonitor-RF V2.17.0 is available in STM32CubeMonitor (MCUs)
- STM32CubeMonitor 1.10.0 is available in STM32CubeMonitor (MCUs)
- Freezing of the STM32CubeIDE environment when including a large file with a data array in STM32CubeIDE (MCUs)
