- STMicroelectronics Community
- STM32 MCUs Software development tools
- STM32CubeIDE (MCUs)
- Re: STM32CubeIDE 1.5.1: Memory viewer broken ?
- Subscribe to RSS Feed
- Mark Topic as New
- Mark Topic as Read
- Float this Topic for Current User
- Bookmark
- Subscribe
- Mute
- Printer Friendly Page
STM32CubeIDE 1.5.1: Memory viewer broken ?
- Mark as New
- Bookmark
- Subscribe
- Mute
- Subscribe to RSS Feed
- Permalink
- Email to a Friend
- Report Inappropriate Content
2020-12-29 5:01 AM
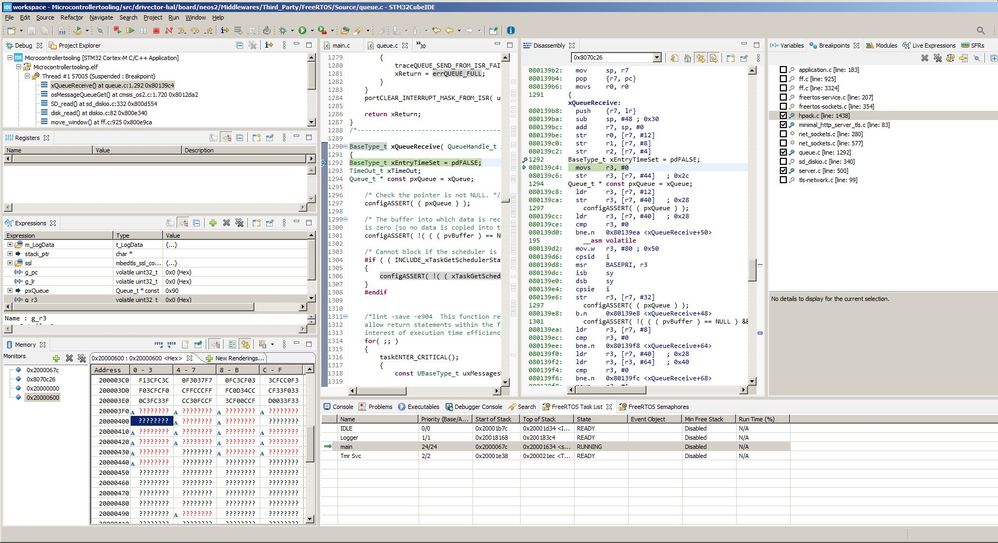
I recently upgraded to 1.5.1 and it seems I am now unable to look at the ram memory anymore for some mysterious reason . Eg I wanted to check the stacks of my freertos tasks but the memory shows up as all ???????? from 0x200003F0 onwards (between 0x2000000 and 0x200003F0 it seems to be ok). I am doing this on an STM32F745ZGTX, it should have 320kb internal memory from 0x2000000 till 0x20050000 so I am definitely in the valid memory range (and my tasks work so their stacks are in valid memory) . I did this before on 1.5.0 or 1.4.0 and don't remember having problems with it, so I am not sure what is going wrong, coincidence or something in 1.5.1 ? Picture below, am I doing something wrong here ?

- Labels:
-
STM32CubeIDE
- Mark as New
- Bookmark
- Subscribe
- Mute
- Subscribe to RSS Feed
- Permalink
- Email to a Friend
- Report Inappropriate Content
2020-12-29 6:38 AM
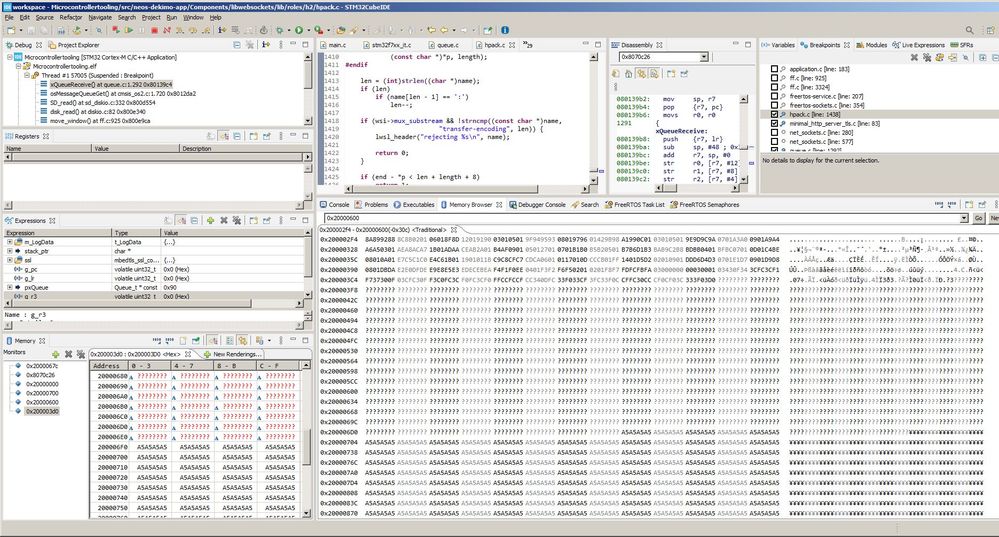
I also just noticed that from 0x200006f0 the memory is populated normally again (not sure if there are other gaps). And as far as I can see there are no "reading *** bytes @ address xxxxx" statements in the console panel for the problematic region so it is like the memory viewer does not even try to read the memory in that block, and just prints the ? marks everywhere.
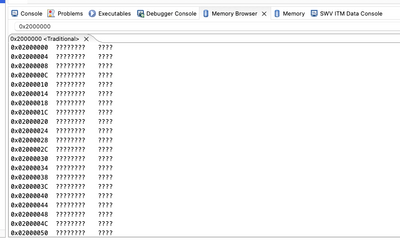
The same gap exists in the memory browser tool as well btw
- Mark as New
- Bookmark
- Subscribe
- Mute
- Subscribe to RSS Feed
- Permalink
- Email to a Friend
- Report Inappropriate Content
2021-01-05 1:34 AM
Hi,
Quite weird that Eclipse does not even seem to request the memory to be read..
Could you attach an ST-LINK instead and try with ST-LINK GDB server and OpenOCD to see if you can observe the same behavior?
We are unable to re-produce and have not seen this issue before.
- Mark as New
- Bookmark
- Subscribe
- Mute
- Subscribe to RSS Feed
- Permalink
- Email to a Friend
- Report Inappropriate Content
2023-09-07 2:54 AM - edited 2023-09-07 2:55 AM
Faced the same problem with
STM32CubeIDE on MacOS
Version: 1.13.1
Build: 17479_20230728_0839 (UTC)
Board: STM32F407G-DISC1

- Mark as New
- Bookmark
- Subscribe
- Mute
- Subscribe to RSS Feed
- Permalink
- Email to a Friend
- Report Inappropriate Content
2025-02-04 3:18 AM
I saw a similar issue. For me at least, the solution was to try to switch over to another project, then switch back over, rebuild and reopen the memory browser
- Viewing SWO without STM32CubeIDE in STM32CubeIDE (MCUs)
- Linux Installation Error - STM32 Cube IDE in STM32CubeIDE (MCUs)
- VSCode extension failing to compile project after STM32CubeIDE update in STM32 VSCode extension (MCUs)
- Unable to Download STM32CubeIDE in STM32CubeIDE (MCUs)
- STMCubeIDE 1.15.1/1.16.1 stuck starting MAKE (discovering built-in language settings) Ubuntu 24.04 & 24.10 in STM32CubeIDE (MCUs)
