Turn on suggestions
Auto-suggest helps you quickly narrow down your search results by suggesting possible matches as you type.
Showing results for
- STMicroelectronics Community
- STM32 MCUs
- STM32 MCUs Products
- Re: Why does the execution time of STM32F767ZIT6 (...
Options
- Subscribe to RSS Feed
- Mark Topic as New
- Mark Topic as Read
- Float this Topic for Current User
- Bookmark
- Subscribe
- Mute
- Printer Friendly Page
Why does the execution time of STM32F767ZIT6 (used in NUCLEO-F767ZI) not grow as expected when the amount of code to execute increases?
Options
- Mark as New
- Bookmark
- Subscribe
- Mute
- Subscribe to RSS Feed
- Permalink
- Email to a Friend
- Report Inappropriate Content
2022-02-16 11:20 AM
I measure the execution time of a function by putting the toggle of a digital output and the function call into a cycle and measuring the period of the square wave at the digital output with an oscilloscope. The execution time is half a period.
To test the procedure, I used instead of the function a dummy code (see main function in the annex execution_time_main.c) where the cnt_max parameter allows me to vary the amount of code to execute.
The measured periods are visible in the attachment CRAZY_TIMES.jpg
I do not understand why both with the ARM V5 and V6 compiler in Keil uVision the trend of the periods is that shown in the attachment CRAZY_TIMES.jpg
- Comp V5, test case 8 to 9 cnt_max go from 8000 to 9000 (increases) and period go from 485 us to 454 us (decreases) !
- Comp V5, test case 10 to 11 cnt_max go from 10 000 to 100 000 (x 10) and period go from 505 us to 11.1 ms (x 22) !
- Comp V6, test case 10 to 11 cnt_max go from 10 000 to 100 000 (x 10) and period go from 607 us to 29.6 ms (x 49) !
Thanks
Labels:
- Labels:
-
DEBUG
-
RCC
-
STM32F7 Series
26 REPLIES 26
Options
- Mark as New
- Bookmark
- Subscribe
- Mute
- Subscribe to RSS Feed
- Permalink
- Email to a Friend
- Report Inappropriate Content
2022-02-16 02:55 PM
I wondered that I made some mistake in my clock_configure function so I disabled it leaving the default clock initialization (now SYSCLK frequency = 16 MHz and not 216 MHz as before, ...)
#if 0
clock_configure();
SystemCoreClockUpdate();
#endif
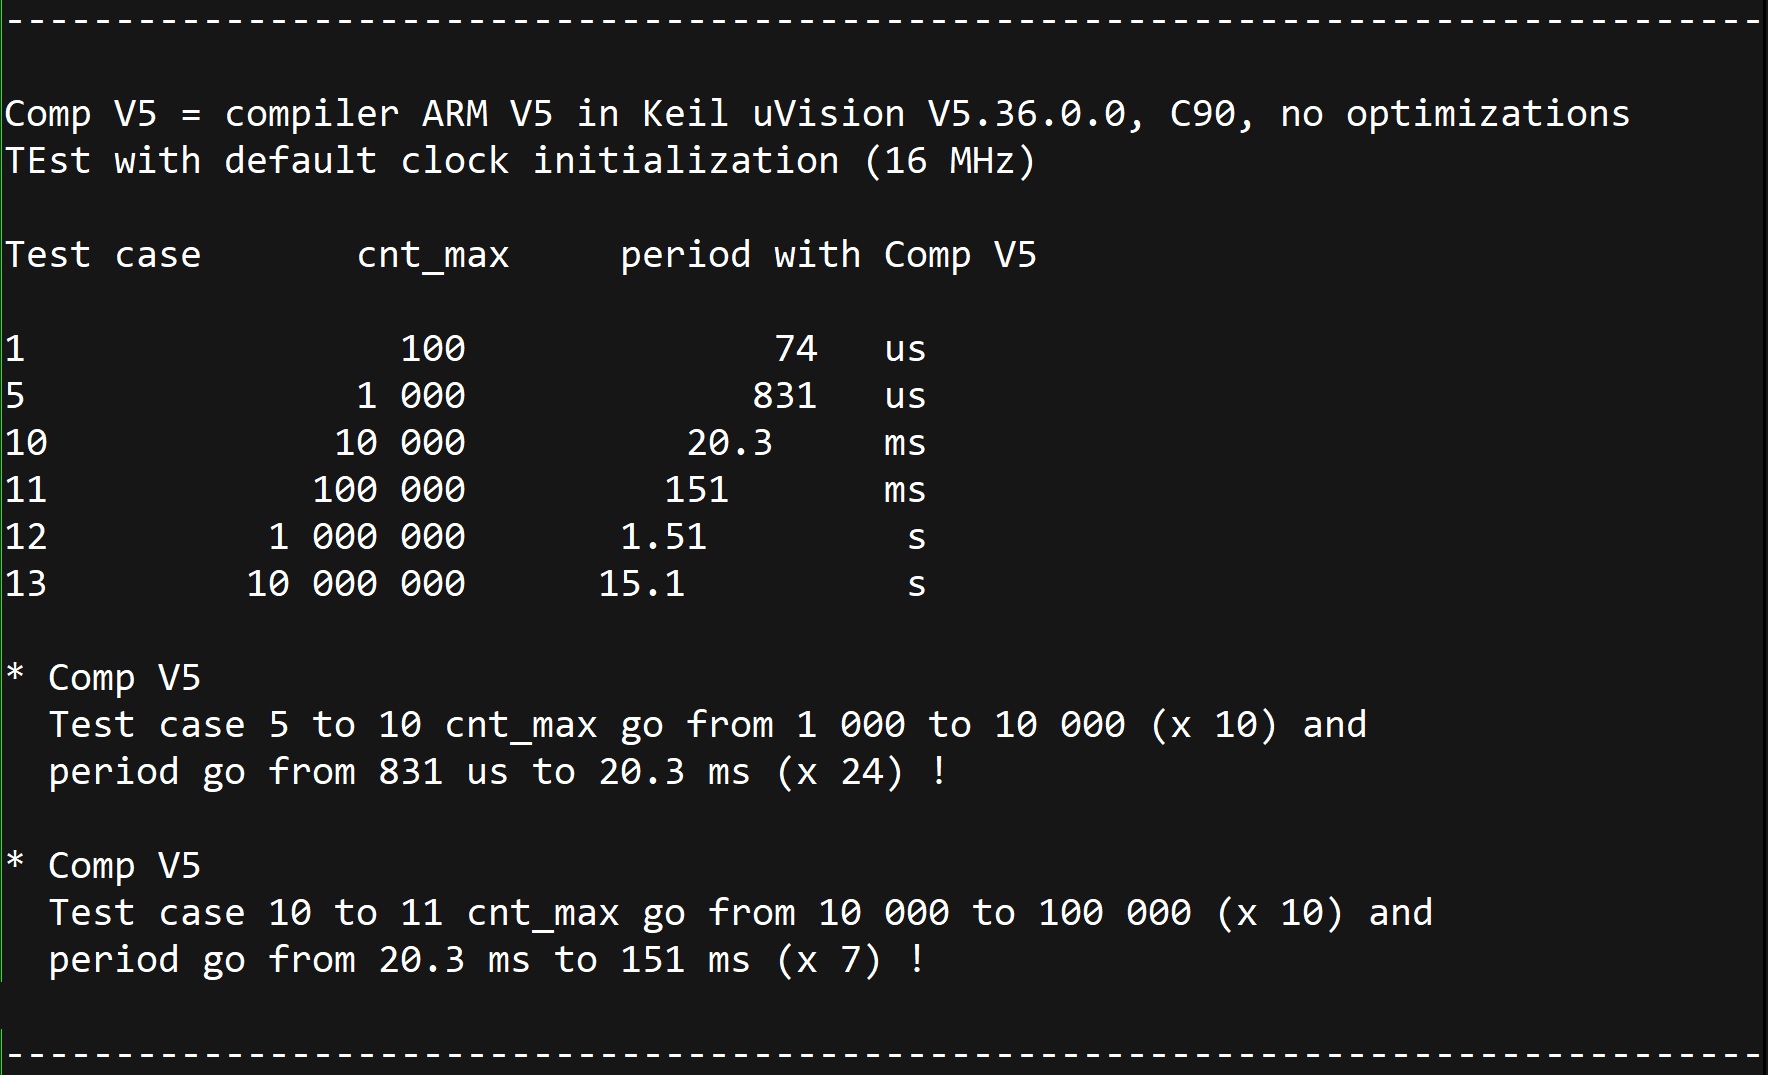
The measured periods are visible in the attachment CRAZY_TIMES_2.jpg
I do not understand why (now i tested only with the ARM V5 compiler) the trend of the periods is that shown in the attachment CRAZY_TIMES_2.jpg
- Comp V5, test case 5 to 10 cnt_max go from 1 000 to 10 000 (x 10) and period go from 831 us to 20.3 ms (x 24) !
- Comp V5, test case 10 to 11 cnt_max go from 10 000 to 100 000 (x 10) and period go from 20.3 ms to 151 ms (x 7) !
just to make sure, I have also determined the periods using the debugger and they are in very good agreement with the measurements made with the oscilloscope.
So the problem is not in my clock_configure_function or in the oscilloscope.
Options
- Mark as New
- Bookmark
- Subscribe
- Mute
- Subscribe to RSS Feed
- Permalink
- Email to a Friend
- Report Inappropriate Content
2022-02-16 03:19 PM
Could you look at the generated code?
Alignment, caching, flash line placement?
Could you run without the debugger?
Could you run all the tests using a singular function, feeding that the iteration count, and self-timing via the DWT CYCCNT machine cycle counter?
Tips, Buy me a coffee, or three.. PayPal Venmo
Up vote any posts that you find helpful, it shows what's working..
Up vote any posts that you find helpful, it shows what's working..
Options
- Mark as New
- Bookmark
- Subscribe
- Mute
- Subscribe to RSS Feed
- Permalink
- Email to a Friend
- Report Inappropriate Content
2022-02-16 03:35 PM
Showing disassembly would be insightful. So would putting the delay into a function and calling that multiple times within the same program with different values. Could be the compiler rearranging things based on the compiled value.
If you feel a post has answered your question, please click "Accept as Solution".
Options
- Mark as New
- Bookmark
- Subscribe
- Mute
- Subscribe to RSS Feed
- Permalink
- Email to a Friend
- Report Inappropriate Content
2022-02-16 04:21 PM
If I had to guess you probably having the tick interrupt running in the background, and sometimes it happens during your timing, and sometimes it does not. (Or maybe some other interrupt.)
Options
- Mark as New
- Bookmark
- Subscribe
- Mute
- Subscribe to RSS Feed
- Permalink
- Email to a Friend
- Report Inappropriate Content
2022-02-17 07:01 AM
Thanks Tesla DeLorean, TDK and KiptonM for the time you are dedicating to me.
Before answering you, I wanted to simplify the code as much as possible. See the attachment execution_time_main_#1.c.
When the line marked with @ 1 was commented, see the attachment execution_time_main_#2.c the period in the case of test case 10 went from 20.3 ms to 6.87 ms.
I find it incomprehensible since this line is not inside the while loop of the Dummy code.
The periods measured for all test cases are visible in the attachment CRAZY_TIMES_3.jpg
Now I turn to the answers to your questions.
- Could you run without the debugger ? Periods in all test cases were measured with oscilloscope without debuggers. See attachment NO_DEBUGGER_SETUP.jpg
- If I had to guess you probably having the tick interrupt running in the background. There should be no interrupts. All the code is what you see in attachment execution_time_ # 1.c or execution_time_ # 2.c
- Could you look at the generated code? Alignment, caching, flash line placement? Showing disassembly would be insightful. See attachments assembly_#1.lst, startup_stm32f767xx_#1.lst, execution_time_#1.map about execution_time_main_#1.c and assembly_#2.lst, startup_stm32f767xx_#2.lst, execution_time_#2.map about execution_time_main_#2.c.
- Could you run all the tests using a singular function, feeding that the iteration count, and self-timing via the DWT CYCCNT machine cycle counter? I have little experience with programming these microcontrollers so it is not clear to me what you are asking me to do when you write "feeding that the iteration count, and self-timing via the DWT CYCCNT machine cycle counter". I'm sorry.
Options
- Mark as New
- Bookmark
- Subscribe
- Mute
- Subscribe to RSS Feed
- Permalink
- Email to a Friend
- Report Inappropriate Content
2022-02-17 07:07 AM
No attachments came through. Putting the delay within a function and calling that multiple times with different values would clear up a lot of unknowns.
Using a scope to time instead of DWT->CYCCNT is fine.
Using a scope to time instead of DWT->CYCCNT is fine.
If you feel a post has answered your question, please click "Accept as Solution".
Options
- Mark as New
- Bookmark
- Subscribe
- Mute
- Subscribe to RSS Feed
- Permalink
- Email to a Friend
- Report Inappropriate Content
2022-02-17 07:12 AM
Options
- Mark as New
- Bookmark
- Subscribe
- Mute
- Subscribe to RSS Feed
- Permalink
- Email to a Friend
- Report Inappropriate Content
2022-02-17 09:32 AM
DWT->CYCCNT is a 32-bit cycle counter built into the debug core of the CM3/4/7 processor.
Pull an ARM Technical Reference Manual to familiarize yourself with it.
uint32_t start, finish, total;
start = DWT->CYCCNT;
test_function(iterations);
finish= DWT->CYCCNT;
total = finish - start; // machine cycles, give-or-take for call, execution, return, couple of load/stores potentially
Suggesting using ONE function, compiled once, so as to remove potential changes in code/placement from one compilation to the next, and so you can time 1000, 1000000 iterations with exactly the same thing instead of introducing a lot on unknowns, and pondering them. You could also disable interrupts across the test to remove those as distractions.
Tips, Buy me a coffee, or three.. PayPal Venmo
Up vote any posts that you find helpful, it shows what's working..
Up vote any posts that you find helpful, it shows what's working..
Options
- Mark as New
- Bookmark
- Subscribe
- Mute
- Subscribe to RSS Feed
- Permalink
- Email to a Friend
- Report Inappropriate Content
2022-02-18 10:58 AM