- STMicroelectronics Community
- STM32 MCUs
- STM32 MCUs Products
- Re: Problem with the interrupt of UART4 of process...
- Subscribe to RSS Feed
- Mark Topic as New
- Mark Topic as Read
- Float this Topic for Current User
- Bookmark
- Subscribe
- Mute
- Printer Friendly Page
Problem with the interrupt of UART4 of processor STM32F072CBT6
- Mark as New
- Bookmark
- Subscribe
- Mute
- Subscribe to RSS Feed
- Permalink
- Email to a Friend
- Report Inappropriate Content
2015-11-22 12:54 PM
- Mark as New
- Bookmark
- Subscribe
- Mute
- Subscribe to RSS Feed
- Permalink
- Email to a Friend
- Report Inappropriate Content
2015-11-22 02:04 PM
Is some bug of the processor?
Probably the least likely cause, guess again. Do you initialize the index variable? Is this in a .CPP file? Where exactly does the processor indicate the faulting instruction is located, and what are the register contents? Assuming you think this is a silicon bug, I hope you've reviewed the TRM to understand what the defined behaviour is, and how this falls outside of that.Up vote any posts that you find helpful, it shows what's working..
- Mark as New
- Bookmark
- Subscribe
- Mute
- Subscribe to RSS Feed
- Permalink
- Email to a Friend
- Report Inappropriate Content
2015-11-24 02:36 AM
If it don't is a silicon bug, for me is very happy. I just want solve my problem.
Do you initialize the index variable? Yes Is this in a .CPP file? No, I'm using a .c file. Follow the state of the register in three moments: in the begin (after the load of program), in a breakpoint initUSART(), and when the processor break. in the begin > reg ===== arm v7m registers (0) r0 (/32): 0xFFFFFFFF (1) r1 (/32): 0xFFFFFFFF (2) r2 (/32): 0xFFFFFFFF (3) r3 (/32): 0xFFFFFFFF (4) r4 (/32): 0xFFFFFFFF (5) r5 (/32): 0xFFFFFFFF (6) r6 (/32): 0xFFFFFFFF (7) r7 (/32): 0xFFFFFFFF (8) r8 (/32): 0xFFFFFFFF (9) r9 (/32): 0xFFFFFFFF (10) r10 (/32): 0xFFFFFFFF (11) r11 (/32): 0xFFFFFFFF (12) r12 (/32): 0xFFFFFFFF (13) sp (/32): 0x20004000 (14) lr (/32): 0xFFFFFFFF (15) pc (/32): 0x08001690 (dirty) (16) xPSR (/32): 0xC1000000 (17) msp (/32): 0x20004000 (18) psp (/32): 0xFFFFFFFC (19) primask (/1): 0x00 (20) basepri (/8): 0x00 (21) faultmask (/1): 0x00 (22) control (/2): 0x00 ===== Cortex-M DWT registers (23) dwt_ctrl (/32) (24) dwt_cyccnt (/32) (25) dwt_0_comp (/32) (26) dwt_0_mask (/4) (27) dwt_0_function (/32) (28) dwt_1_comp (/32) (29) dwt_1_mask (/4) (30) dwt_1_function (/32) in a breakpoint initUSART() > reg ===== arm v7m registers (0) r0 (/32): 0x00000002 (1) r1 (/32): 0x0011000A (2) r2 (/32): 0x00000008 (3) r3 (/32): 0x40021000 (4) r4 (/32): 0xFFFFFFFF (5) r5 (/32): 0xFFFFFFFF (6) r6 (/32): 0xFFFFFFFF (7) r7 (/32): 0xFFFFFFFF (8) r8 (/32): 0xFFFFFFFF (9) r9 (/32): 0xFFFFFFFF (10) r10 (/32): 0xFFFFFFFF (11) r11 (/32): 0xFFFFFFFF (12) r12 (/32): 0xFFFFFFFF (13) sp (/32): 0x20003FF8 (14) lr (/32): 0x080016DF (15) pc (/32): 0x08000250 (16) xPSR (/32): 0x61000000 (17) msp (/32): 0x20003FF8 (18) psp (/32): 0xFFFFFFFC (19) primask (/1): 0x00 (20) basepri (/8): 0x00 (21) faultmask (/1): 0x00 (22) control (/2): 0x00 ===== Cortex-M DWT registers (23) dwt_ctrl (/32) (24) dwt_cyccnt (/32) (25) dwt_0_comp (/32) (26) dwt_0_mask (/4) (27) dwt_0_function (/32) (28) dwt_1_comp (/32) (29) dwt_1_mask (/4) (30) dwt_1_function (/32) Bug processor break > reg ===== arm v7m registers (0) r0 (/32): 0x40004C00 (1) r1 (/32): 0x0000006C (2) r2 (/32): 0x0000002C (3) r3 (/32): 0x0000007F (4) r4 (/32): 0x0000006C (5) r5 (/32): 0xFFFFFFFF (6) r6 (/32): 0xFFFFFFFF (7) r7 (/32): 0xFFFFFFFF (8) r8 (/32): 0xFFFFFFFF (9) r9 (/32): 0xFFFFFFFF (10) r10 (/32): 0xFFFFFFFF (11) r11 (/32): 0xFFFFFFFF (12) r12 (/32): 0xFFFFFFFF (13) sp (/32): 0x20003FA8 (14) lr (/32): 0xFFFFFFF1 (15) pc (/32): 0x080000DA (16) xPSR (/32): 0x01000003 (17) msp (/32): 0x20003FA8 (18) psp (/32): 0xFFFFFFFC (19) primask (/1): 0x00 (20) basepri (/8): 0x00 (21) faultmask (/1): 0x00 (22) control (/2): 0x00 ===== Cortex-M DWT registers (23) dwt_ctrl (/32) (24) dwt_cyccnt (/32) (25) dwt_0_comp (/32) (26) dwt_0_mask (/4) (27) dwt_0_function (/32) (28) dwt_1_comp (/32) (29) dwt_1_mask (/4) (30) dwt_1_function (/32) Thanks for reply- Mark as New
- Bookmark
- Subscribe
- Mute
- Subscribe to RSS Feed
- Permalink
- Email to a Friend
- Report Inappropriate Content
2015-11-24 04:11 AM
Unfortunately that doesn't provide me with adequate context. Have you looked at coding a Hard Fault Handler to decode the location/nature of the fault. Take a look a Joseph Yiu's examples.
int possitionUart = 0 ; //possition of next byte of receiveerBuffer You might want to check how the variable starts, and advances, and is kept within the scope of the buffer. Double check the vector table, and that the IRQHandler links in properly. Review the MAP and Listing files.Up vote any posts that you find helpful, it shows what's working..
- Mark as New
- Bookmark
- Subscribe
- Mute
- Subscribe to RSS Feed
- Permalink
- Email to a Friend
- Report Inappropriate Content
2017-06-07 10:22 AM
Hi,
I know that it is a very old post, but I am facing the same issue. I have a STM32F072, and I am trying to use the USART4 by interruption. I double - checked the interruption vector and it is ok, but when the interruption occurs the PC is jumped to 0x0800BE00, and just after it goes to a hardfault (because I have nothing on this area, it means 0xffffffff, so wrong instruction).
It is very strange as this address (0x0800BE00) is out of linker script region and it is not present in any position of interruption vector.
Does anyone have some idea?
- Mark as New
- Bookmark
- Subscribe
- Mute
- Subscribe to RSS Feed
- Permalink
- Email to a Friend
- Report Inappropriate Content
2017-06-07 05:52 PM
And what is the content of SYSCFG_CFGR1.MEM_MODE at that moment?
I double - checked the interruption vector
So check it the third time, by actually reading out the content of the vector table, and post it here.
JW
- Mark as New
- Bookmark
- Subscribe
- Mute
- Subscribe to RSS Feed
- Permalink
- Email to a Friend
- Report Inappropriate Content
2017-06-07 06:49 PM
Hi JW,
In this case,
SYSCFG_CFGR1.MEM_MODE = 00 (Flash), but I also have tried 11 (SRAM), but the result was the same.
- Mark as New
- Bookmark
- Subscribe
- Mute
- Subscribe to RSS Feed
- Permalink
- Email to a Friend
- Report Inappropriate Content
2017-06-07 07:05 PM
Interruption table:

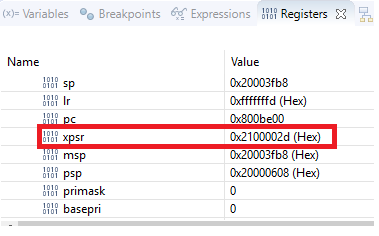
and the xpsr register:

- Mark as New
- Bookmark
- Subscribe
- Mute
- Subscribe to RSS Feed
- Permalink
- Email to a Friend
- Report Inappropriate Content
2017-06-08 05:15 AM
The interrupt number from xpsr matches the USART4... it's a hummm...
And what happens if you try to trigger the interrupt from USART3?
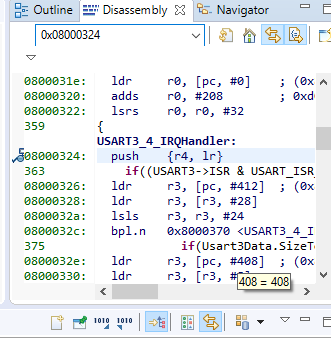
What exactly is on address 08000324, can you show us (disasm)? Do you have a breakpoint at that address, or only at 0x0800BE00?
JW
- Mark as New
- Bookmark
- Subscribe
- Mute
- Subscribe to RSS Feed
- Permalink
- Email to a Friend
- Report Inappropriate Content
2017-06-08 07:33 AM
As USART3 and USART4 were sharing the same IRQ, the result is the same. BTW, USART1 and USART2 are working properly.
I have my USART3_4_IRQHandler at 0x08000324, and I have a breakpoint on there. See picture below:

- STM32WB55 Low Power Mode problem (stop mode and sleep mode) in STM32 MCUs Wireless
- Interrupt while in FreeRTOS PendSVHandler later causing NMI in STM32 MCUs Embedded software
- DCT Issue: Missing HAL Interrupt Handler for USART6 in STM32CubeMX (MCUs)
- DAC not working in bare metal on STM32F756VGH6 in STM32 MCUs Embedded software
- Breakpoint not triggering in STM32CubeIDE in STM32CubeIDE (MCUs)