- STMicroelectronics Community
- STM32 MCUs Software development tools
- STM32CubeIDE (MCUs)
- Re: Restart session from debugger in custom memory...
- Subscribe to RSS Feed
- Mark Topic as New
- Mark Topic as Read
- Float this Topic for Current User
- Bookmark
- Subscribe
- Mute
- Printer Friendly Page
Restart session from debugger in custom memory location STM32CubeIDE
- Mark as New
- Bookmark
- Subscribe
- Mute
- Subscribe to RSS Feed
- Permalink
- Email to a Friend
- Report Inappropriate Content
2020-07-18 1:53 AM
Hi guys,
I have reserved 8K of flash in my STM32F030CC for a bootloader/updater program so my main application starts at 0x08002000. When I compile and debugg, the debugger is smart enough to know where to start, but when I click on reset session and start debug the chip seems to be reset and I guess it tries to start at 0x08000000. Is there anyway to tell the debugger to start where my application code starts after a reset?
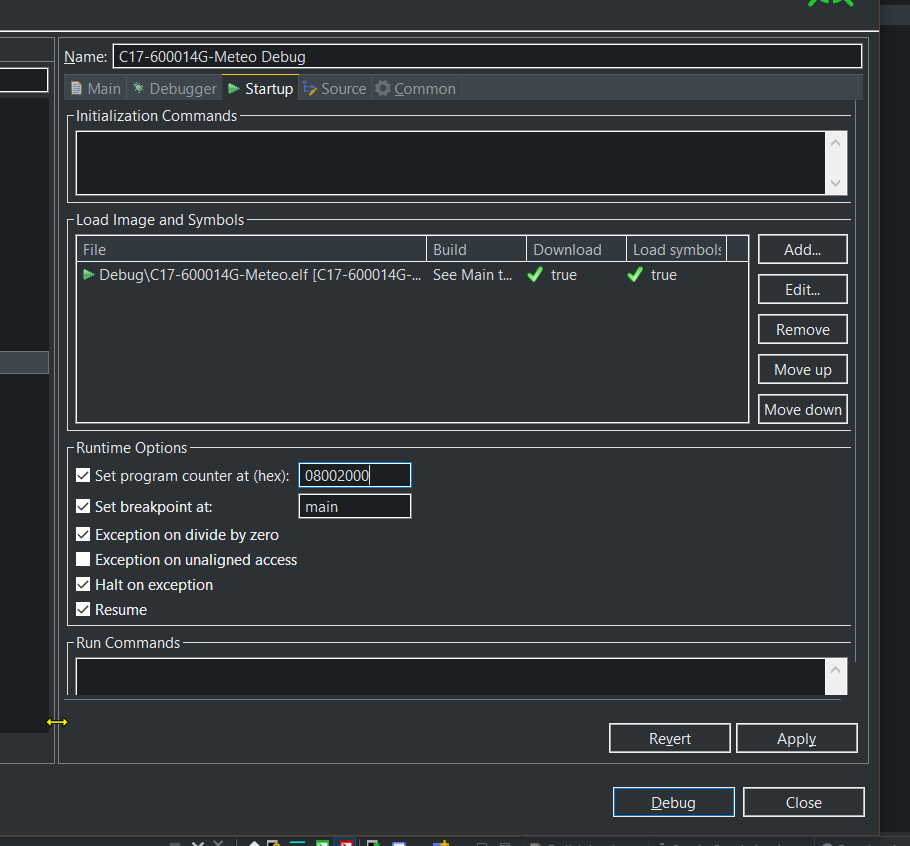
I have tried the option "Set PC at 0x08002000" which is where the flash for the app image starts, as seen in the picture but there is no breakpoint at start from where to start.
have also modified the script for the linker as follows.
MEMORY
{
  UPDATER (rx)    : ORIGIN = 0x08000000, LENGTH = 8K
/*  FIRMWARE (rx)   : ORIGIN = 0x08002000, LENGTH = 240K*/
  FIRMWARE (rx)   : ORIGIN = 0x08002000, LENGTH = 132K
  LOGGER (r)      : ORIGIN = 0x08023000, LENGTH = 108K
  PARAMS (r)      : ORIGIN = 0x0803E000, LENGTH = 8K
  VTRAM (xrw)     : ORIGIN = 0x20000000, LENGTH = 0xc0  /* First part of RAM is reserved to the vector table */
  RAM (xrw)       : ORIGIN = 0x200000C0, LENGTH = 32K - 192
}

REGION_ALIAS( "FLASH", FIRMWARE );

_main_app_start_address      = 0x08002000;
_logger_start_address   = 0x08023000;
/*_logger_start_address        = 0x0000;*/
_logger_events_start_address = 0x08037000; /* events start address*/
_params_start_address        = 0x0803E000;
_main_app_size = 132K;
_logger_size   = 108K;
_logger_meas_size   =   80K;   /* datalogger measures size */
/*_logger_meas_size = 7168K;*/  /* datalogger measures size */
_logger_event_size = 20K;       /* datalogger events size   */
_params_size       = 8K;

.
.
.
.

  .ARM.attributes 0 : { *(.ARM.attributes) }
  /* RAM space for the vector table */
  .RAMVectorTable(NOLOAD): {*(.RAMVectorTable)} >VTRAM
The VTRAM is where I am remapping my vector table and I use the following code in the main:
__IO uint32_t VectorTable[48] __attribute__((section(".RAMVectorTable")));
.
.
.

    // Copy interrupt vector table to the RAM.
    uint32_t volatile ui32_VectorIndex = 0;

    for (ui32_VectorIndex = 0; ui32_VectorIndex < 48; ui32_VectorIndex++)
    {
        VectorTable[ui32_VectorIndex] = *(__IO uint32_t*) ( APPLICATION_ADDRESS + (ui32_VectorIndex << 2));
    }

    /* Reset SYSCFGRST peripheral clock */
    __HAL_RCC_APB2_FORCE_RESET();
    /* Enables SYSCFGRST peripheral clock */
    __HAL_RCC_SYSCFG_RELEASE_RESET();
    __HAL_RCC_APB2_RELEASE_RESET();

    /* Remap SRAM at 0x00000000 */
    __HAL_SYSCFG_REMAPMEMORY_SRAM();
This I believe works fine as I am getting the interrupts correctly and it was also working in atollic which I ported from.
Not sure if you can give some tips to configure the debugger to I can hit the restart session and debug without having to flash the memory again...
Thanks a lot in advance!!
- Labels:
-
DEBUG
-
STM32CubeIDE
-
STM32F0 Series
- Mark as New
- Bookmark
- Subscribe
- Mute
- Subscribe to RSS Feed
- Permalink
- Email to a Friend
- Report Inappropriate Content
2020-07-18 12:44 PM
An usual advice is to always have some kind of bootloader in place so it will jump to your app.
If bootloader is not ready yet, put there dummy minimal code for now.
-- pa
- Mark as New
- Bookmark
- Subscribe
- Mute
- Subscribe to RSS Feed
- Permalink
- Email to a Friend
- Report Inappropriate Content
2020-07-19 4:09 AM
Hi Pavel,
As you very well suggested I put in place a light version of booloader in memory and in fact now when the chip resets, I guess it runs my bootloader code and jumps into my application.
Now I am able to restart the debugger session without having to flahs the micro every time. Thanks for that!!
Nevertheless I thought the debugger was smart enough to be able to be configured to start from a custom memory address...
Thanks a lot again!
- Debug Mode not Working STM32F469I-DISCO in STM32CubeIDE in STM32CubeIDE (MCUs)
- How to fix this error will not fit in region `RAM_D1' in STM32CubeIDE (MCUs)
- STM32Cube Does Not Work After Formatting the Computer in STM32CubeIDE (MCUs)
- Issue Running STM32CubeH7RS LED Toggle Example from External Flash in STM32CubeIDE (MCUs)
- STM32CubeIDE(Ver1.17.0) build link error. in STM32CubeIDE (MCUs)
