- STMicroelectronics Community
- STM32 MCUs Software development tools
- STM32CubeIDE (MCUs)
- Re: Code performance profiling
- Subscribe to RSS Feed
- Mark Topic as New
- Mark Topic as Read
- Float this Topic for Current User
- Bookmark
- Subscribe
- Mute
- Printer Friendly Page
Code performance profiling
- Mark as New
- Bookmark
- Subscribe
- Mute
- Subscribe to RSS Feed
- Permalink
- Email to a Friend
- Report Inappropriate Content
2023-09-21 2:36 AM
Hello,
Is there an integrated tool in STM32CubeIDE that I can use to measure how long a block of code lasts?
I was used to use a similar tool on TI CodeComposer, that measured the elapsed clocks from a breakpoint to another.
Thank you,
Carlo
- Mark as New
- Bookmark
- Subscribe
- Mute
- Subscribe to RSS Feed
- Permalink
- Email to a Friend
- Report Inappropriate Content
2023-09-21 6:32 AM
No, there's nothing built in like this in STM32CubeIDE. You can use DWT->CYCCNT on chips that have it to get an idea of code performance, or make your own profiling measurement.
- Mark as New
- Bookmark
- Subscribe
- Mute
- Subscribe to RSS Feed
- Permalink
- Email to a Friend
- Report Inappropriate Content
2023-09-22 4:08 AM
Hello everyone,
@TDK
I am using a STM32G0x1 and, standing on what is written in the reference manual, this MCU should have the Data Watchpoin Unit.
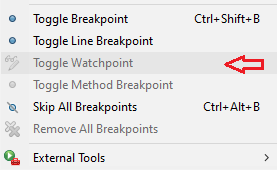
Anyway, if I try to write DWT in the expression window, the symbol is unknown and it seems that is not possible to add watchpoints (the menù entry is disabled).
@davidlora
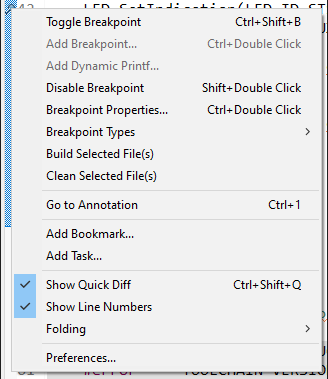
If I right-click on a breakpoint, the "Profile Instruction Counter" option isn't present in the context menù.
Could it be that "Profile Instruction Counter" is an external plug-in or that my IDE version (v.1.11.2) is too old?
Or that "Profile Instruction Counter" is a watchpoint context menu option, instead of a breakpoint one?
Thank you,
Carlo
- CubeMX generated code error when using BSP code in STM32CubeIDE (MCUs)
- Unable to start motor with MC sdk generated code in STM32CubeIDE (MCUs)
- H7 QSPI XIP single mode demo fails in STM32CubeIDE (MCUs)
- Code coverage, lint check, memory profiling with STM32CubeIDE in STM32CubeIDE (MCUs)
- HW or SW issue? in STM32CubeIDE (MCUs)

