- STMicroelectronics Community
- STM32 MCUs Software development tools
- STM32 VSCode extension (MCUs)
- meet “Unable to stat debugging. Debug server proce...
- Subscribe to RSS Feed
- Mark Topic as New
- Mark Topic as Read
- Float this Topic for Current User
- Bookmark
- Subscribe
- Mute
- Printer Friendly Page
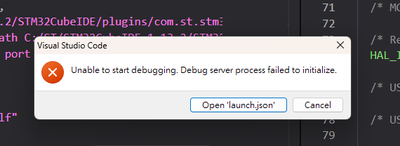
meet “Unable to stat debugging. Debug server process failed to initialize” in VSC when debugging
- Mark as New
- Bookmark
- Subscribe
- Mute
- Subscribe to RSS Feed
- Permalink
- Email to a Friend
- Report Inappropriate Content
2023-10-18 06:12 AM
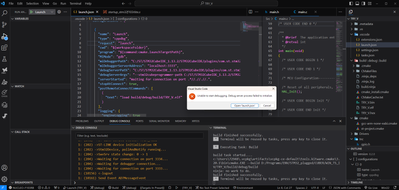
I am trying to use STM32 VSC extension plugin on VSCode for a better coding experience, but error occored when I am trying to debugging.
VSCode suggested that build task finish successfully in the terminal.
It seems debugger failed to connect debug server. [I am not sure what debug server is and how they work. The only thing I know is that launch file has set up 2 tools named:
1: (140) Starting: "C:/ST/STM32CubeIDE_1.13.2/STM32CubeIDE/plugins/com.st.stm32cube.ide.mcu.externaltools.stlink-gdb-server.win32_2.1.0.202305091550/tools/bin/ST-LINK_gdbserver.exe" --stm32cubeprogrammer-path C:/ST/STM32CubeIDE_1.13.2/STM32CubeIDE/plugins/com.st.stm32cube.ide.mcu.externaltools.cubeprogrammer.win32_2.1.0.202305091550/tools/bin --swd --port-number 3333
1: (334) ->
1: (339) ->
1: (339) ->STMicroelectronics ST-LINK GDB server. Version 7.4.0
1: (340) ->Copyright (c) 2023, STMicroelectronics. All rights reserved.
1: (340) ->
1: (340) ->Starting server with the following options:
1: (340) -> Persistent Mode : Disabled
1: (340) -> Logging Level : 31
1: (340) -> Listen Port Number : 3333
1: (340) -> Status Refresh Delay : 15s
1: (340) -> Verbose Mode : Disabled
1: (341) -> SWD Debug : Enabled
1: (341) ->
1: (346) ->COM frequency = 4000 kHz
1: (347) ->Target connection mode: Default
1: (353) ->Reading ROM table for AP 0 @0xe00fffd0
1: (356) ->Hardware watchpoint supported by the target
1: (359) ->ST-LINK Firmware version : V2J42M27
1: (360) ->Device ID: 0x410
1: (360) ->PC: 0x8000d10
1: (360) ->ST-LINK device status: HALT_MODE
1: (360) ->ST-LINK detects target voltage = 3.26 V
1: (361) ->ST-LINK device status: HALT_MODE
1: (361) ->ST-LINK device initialization OK
1: (361) ->Stm32Device, pollAndNotify running...
1: (363) ->SwvSrv state change: 0 -> 1
1: (364) ->Waiting for debugger connection...
1: (364) ->Waiting for connection on port 3333...
1: (364) ->Waiting for connection on port 3334...
1: (10323) <-logout
1: (10339) Send Event AD7MessageEvent
This is my "launch.json" file:

Solved! Go to Solution.
- Labels:
-
VSCode for STM32
Accepted Solutions
- Mark as New
- Bookmark
- Subscribe
- Mute
- Subscribe to RSS Feed
- Permalink
- Email to a Friend
- Report Inappropriate Content
2023-10-22 12:42 AM
Laterly, I founded a tips by browsing the overview page of STM32 VS Code Extensions on VSC Market place which says: When starting the debugger it can happen the connection to the board fails with a Visual Studio Code message reporting "Unable to start debugging. No process is associated with this object."
The root cause can be identified in the DEBUG CONSOLE. Most probably the following message is reported: "Error in initializing ST-LINK device. Reason: ST-LINK firmware upgrade required."
Then I tried to update my stlink firmware by "CubeProgrammer", and everything in vscode are running normally now.
- STM32Cube IDE problem flashing the code in STM32CubeIDE (MCUs)
- Is it possible to disable arm-none-eabi-gdb.exe --version checking, when it start debug? in STM32CubeIDE (MCUs)
- Issue with Flashloader after applying the IAR patch to Support STM32G4 in IAR 8.22 in STM32CubeProgrammer (MCUs)
- Tips for debugging programs with CubeIDE in STM32CubeIDE (MCUs)
- Calculate CPU Active % in a debug build with firmware based on STM32U575, FreeRTOS, and STM32CubeIDE in STM32CubeIDE (MCUs)
