- STMicroelectronics Community
- Knowledge base
- STM32 MCUs
- How to solve debugger connection issues
- Subscribe to RSS Feed
- Mark as New
- Mark as Read
- Bookmark
- Subscribe
- Email to a Friend
- Printer Friendly Page
- Report Inappropriate Content
How to solve debugger connection issues
- Subscribe to RSS Feed
- Mark as New
- Mark as Read
- Bookmark
- Subscribe
- Email to a Friend
- Printer Friendly Page
- Report Inappropriate Content
on
2022-04-04
1:07 AM
- edited on
2025-08-04
4:25 AM
by
![]() Laurids_PETERSE
Laurids_PETERSE
Introduction
The debugger requires some specific pins to communicate with the MCU, if those pins are used for other purpose, the user won’t be able to assure this communication and track the code would not be achieved.
This article describes the ways to prevent or fix debugger connection issues
1. Prerequisites
STM32CubeMX
STM32CubeProgrammer
STM32CubeIDE
2. Steps
2.1 Preventing debug issues using CubeMX
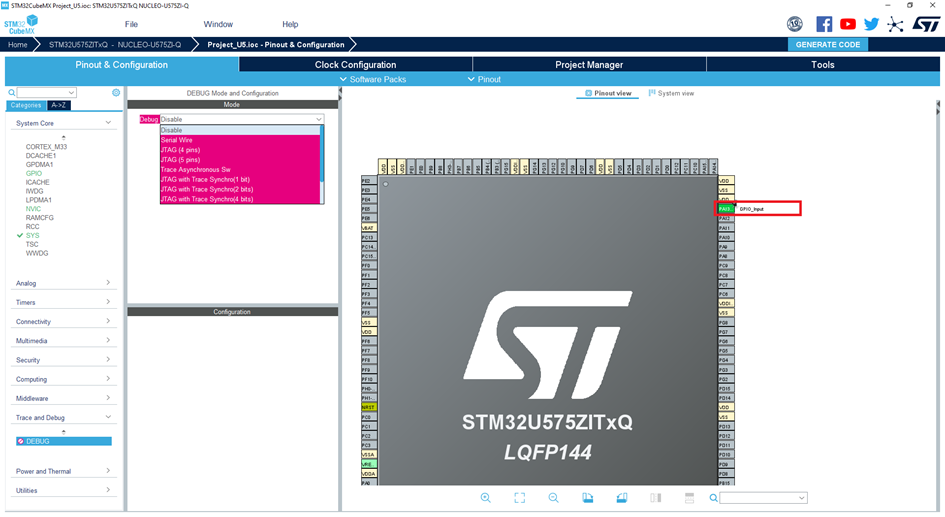
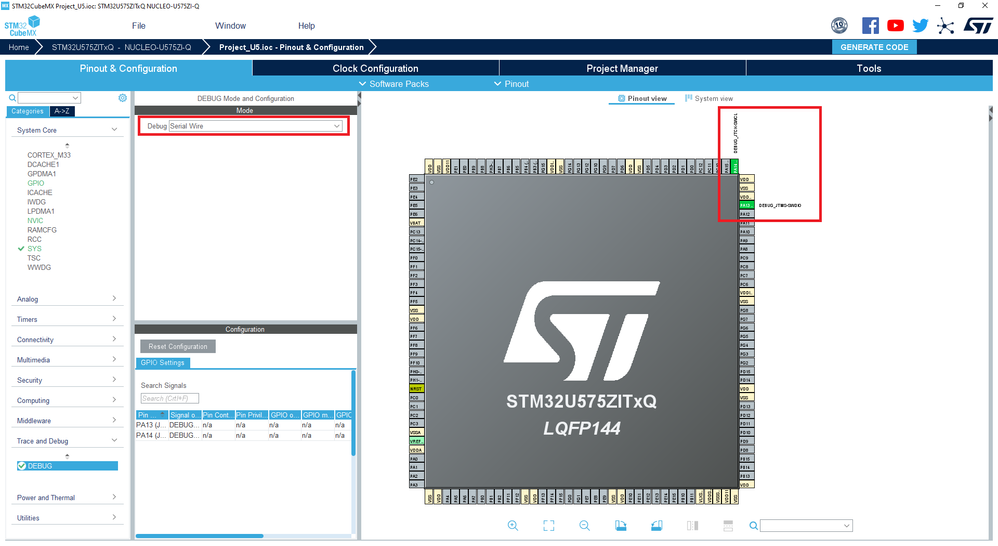
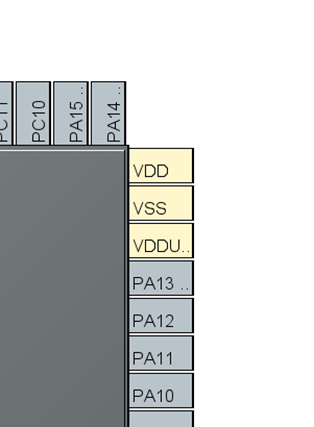
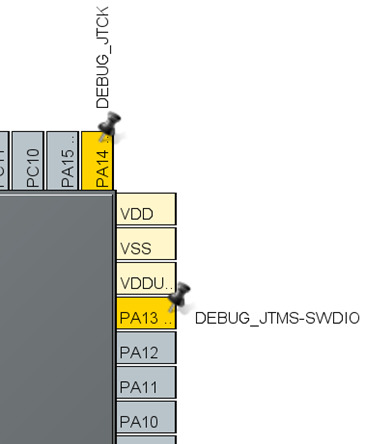
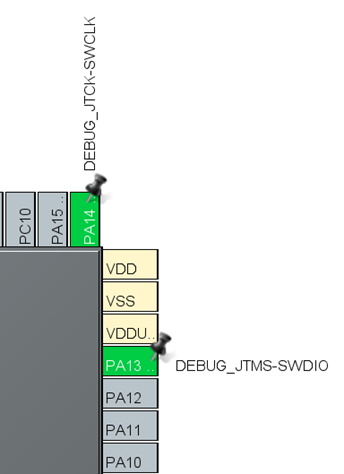
The easiest and only way to prevent connection issues using CubeMX is to make sure that your debug pins are Free, Reserved for Debug or Used by the Debug.
Generally, SWD is mapped on PA13 (SWDIO) and PA14 (SWCLK). This is the default state after reset.
Taking the example of Serial Wire Debugging for a NUCLEO-U575ZI-Q
| Free | Reserved for Debug | Used by the Debug |
|---|---|---|
 |
 |
 |
Note:
It is always recommended to activate the debug interface in MX, this will protect the IO pins from being used by another IP.
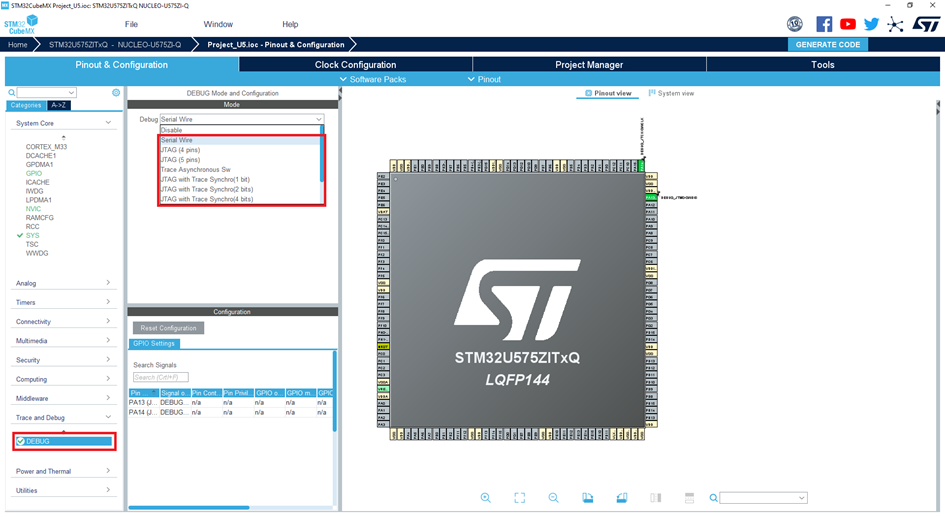
Note:
In CubeMX interface, the Debug section can be found under System Core > SYS IP for the legacy products.
2.2 Solving debug connection issues
In case, one of the debug pins have been set accidently to any other signal than SWDIO and SWCLK. Then you generated the code and loaded it in the MCU.
During Debug, the message “Target is not responding, retrying...” will keep showing up in the IDE console and eventually the connection will be lost.
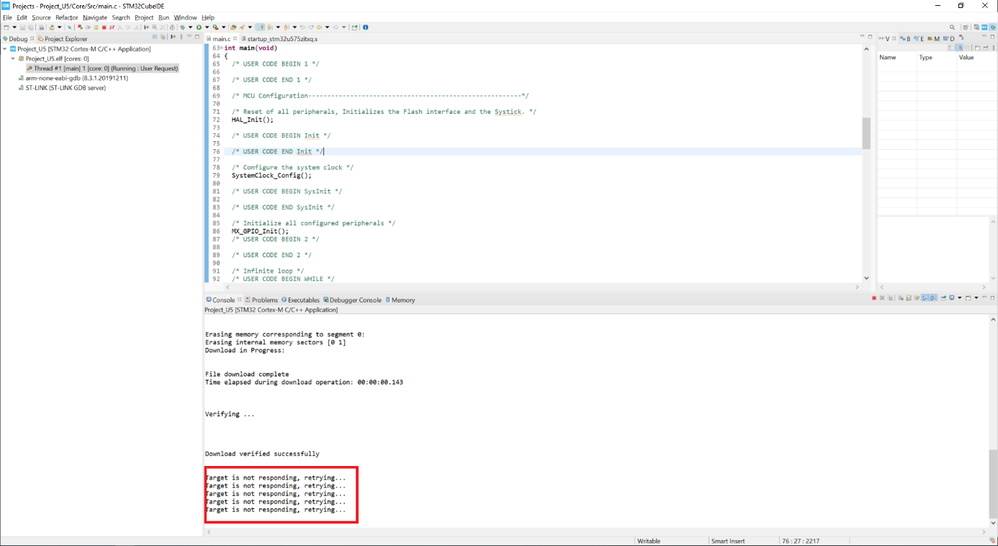
In this case, the only way to take back the control of the board is by connecting it under reset using the NRST pin.
Debug pins must be overwritten by the debugger to achieve the communication, this can be done using STM32CubeProgrammer or the IDE (CubeIDE, MDK-ARM or EWARM).
2.2.1. STM32CubeProgrammer
Step 1: Connect the board
Reset and Connection modes can be selected in the ST-LINK configuration Panel.
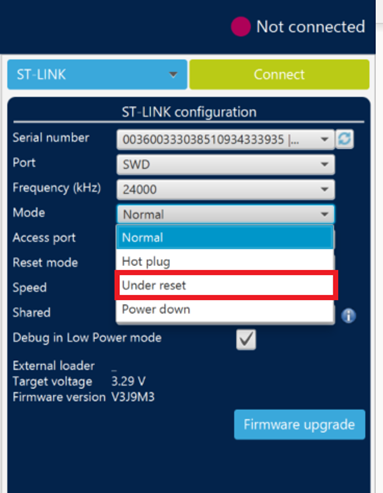 |
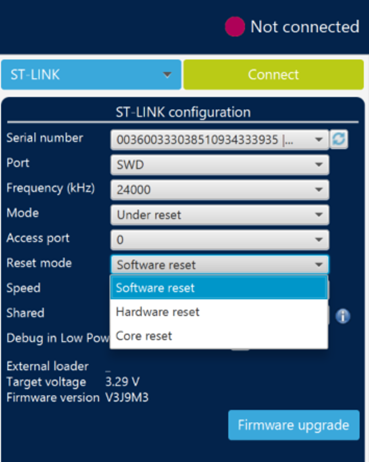 |
Step 2: Mass erase the MCU
Once connected, Mass erase the Chip
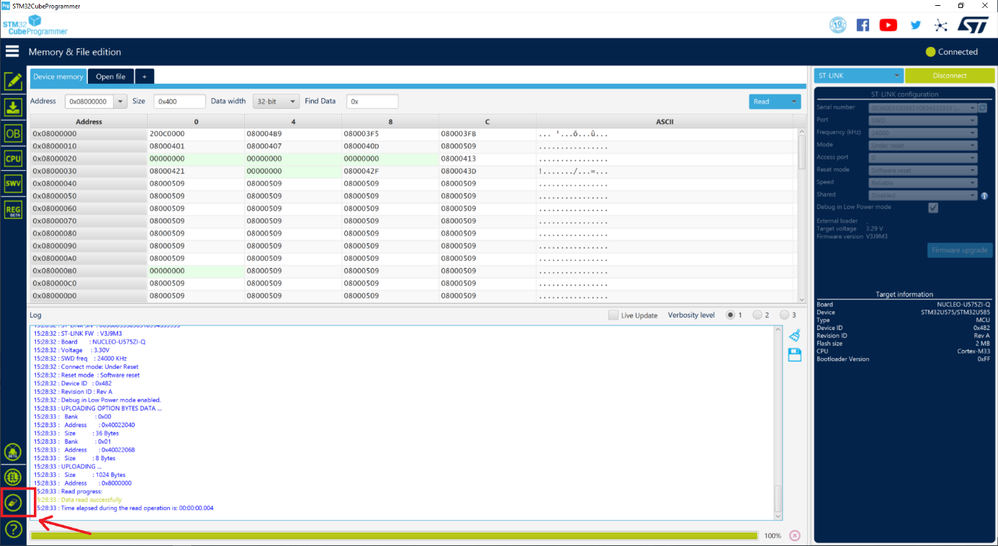
The Mass Erase function erases the full memory, A message “Mass erase successfully achieved” will be displayed in case of success.
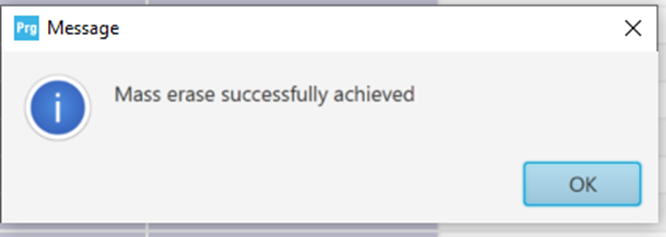
After doing these steps, the board will be able to communicate with the debugger.
2.2.2. STM32CubeIDE
Step 1: Debug interface check in MX
Return to CubeMX and activate the Debug.
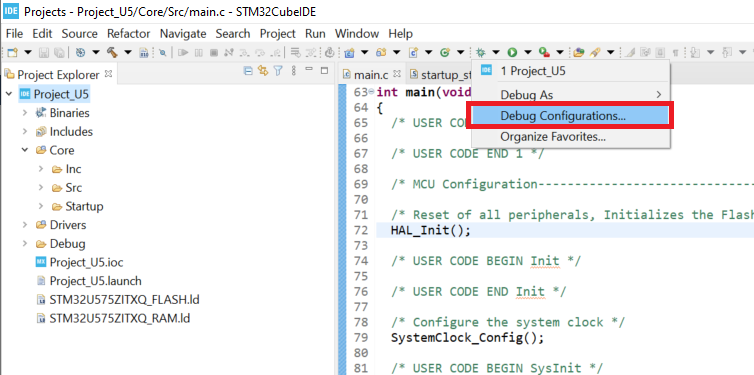
Step 2: Debug configuration in CubeIDE
After code re-generation, open debug configuration
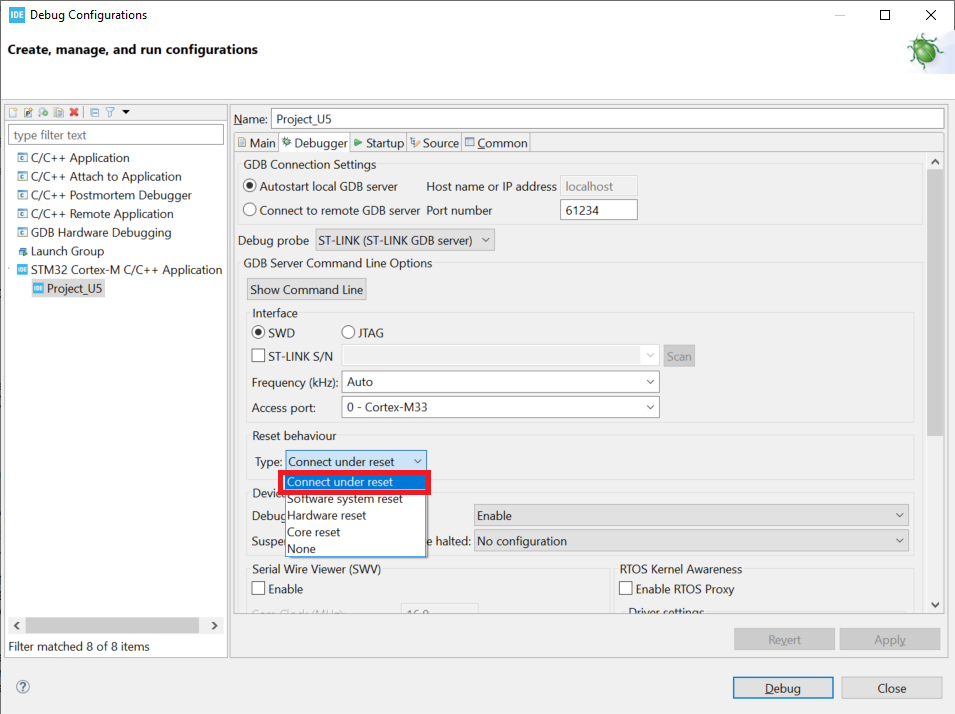
And change the Reset behavior type to “Connect Under Reset”
Click on Apply, then debug the board.
3. Related links
For more details, please check AN4989 , section 4,
- EWARM section 4.2.2
- MDK-ARM section 4.2.3
STM32CubeMX install link
STM32CubeProgrammer install link
STM32CubeIDE install link
- Mark as Read
- Mark as New
- Bookmark
- Permalink
- Email to a Friend
- Report Inappropriate Content
I have tried with stmcubeprogrammer step one but getting this error below. My Board is Stm32WLxx.
15:43:24 : UR connection mode is defined with the HWrst reset mode
15:43:24 : ST-LINK SN : 13002900130000544141514E
15:43:24 : ST-LINK FW : V2J42S7
15:43:24 : Board : --
15:43:24 : Voltage : 3.25V
15:43:24 : Error: No STM32 target found! If your product embeds Debug Authentication, please perform a discovery using Debug Authentication
- Mark as Read
- Mark as New
- Bookmark
- Permalink
- Email to a Friend
- Report Inappropriate Content
Check that jumpers on the board are in default position.
- Mark as Read
- Mark as New
- Bookmark
- Permalink
- Email to a Friend
- Report Inappropriate Content
- I'm working with these modules, I'm quite sure these are ST clone, even the pinout is not marked.
- Mark as Read
- Mark as New
- Bookmark
- Permalink
- Email to a Friend
- Report Inappropriate Content
As you are using a STLink Clone, did you check your precedures against a know working setup? It seem at the moment both debugger and target board are unknown. First check your procedures with both end know working, e.g. a ST Nucleo Board and check your procedures are working.When working, attach the clone to the Nucleo, disabling the on board STLink and check again. When still working, connect to yout target board.
- Mark as Read
- Mark as New
- Bookmark
- Permalink
- Email to a Friend
- Report Inappropriate Content
@MahadiHasan32 Yes, those units are definitely clones - they are not ST products (the ST logo is fake).
Beware that the pinouts on those things are not consistent:
- Mark as Read
- Mark as New
- Bookmark
- Permalink
- Email to a Friend
- Report Inappropriate Content
Im also facing same issue, but im using Nucleo-H7A3ZI-Q Development Board, can you please help me to resolve the issue
Re: STM32H7A3ZIT6 - Code not automatically startin... - STMicroelectronics Community
- Mark as Read
- Mark as New
- Bookmark
- Permalink
- Email to a Friend
- Report Inappropriate Content
The first thing to check is whether the Host system (eg, PC) can connect to the ST-Link.
On Windows, the Device Manager should show both an 'ST-Link Debug' device and an ST-Link Virtual COM Port (if the ST-Link supports it):
Without this basic connection from the Host to the ST-Link, nothing else can even begin to work!
If the ST-Link is not detected, check your cable: are you sure it's a full data cable - not jus a charging cable?
Try other cables.
Try other USB ports (for an example of why this can make a difference, see here).
If connecting via a hub, try without it; if connecting without a hub, try with one - a powered one.
Try connection with no other USB devices - including hubs or "docking stations" - attached.
Beware that the USB connectors on dev boards can be quite fragile.
See Also: How to solve connection errors when connecting and programming the STM32 target board.
PS:
Specifically for ST-Link V3, see: "FAQ: Possible communication failure between STLINK-V3 and some recent computers":
PPS:
Another common cause for debug comms failure is poor wiring - including poor power supply connections.
Wiring should be kept short, neat, and direct - with the minimum of joints.
Be particularly wary of solderless breadboards, cheap "dupont" style headers, etc:
Another example:
And another:
An example of insufficient power from the USB Host:
Note on USB C cables, particularly with STLINK-V3EC:
An example where "try other USB ports" worked:
With designs based on STM32H7, it's important to get the power configuration (SMPS and LDO) correct:
How can I recover my STM32H7/STM32H7RS board after facing a power configuration deadlock?
How to unbrick an STM32H7 after setting the wrong power mode
