- STMicroelectronics Community
- STM32 MCUs
- STM32 MCUs Products
- Re: What Happened during while() loop?
- Subscribe to RSS Feed
- Mark Topic as New
- Mark Topic as Read
- Float this Topic for Current User
- Bookmark
- Subscribe
- Mute
- Printer Friendly Page
What Happened during while() loop?
- Mark as New
- Bookmark
- Subscribe
- Mute
- Subscribe to RSS Feed
- Permalink
- Email to a Friend
- Report Inappropriate Content
2017-08-30 04:05 AM
I recently noticed a strange case on STM32F7
I measure the execution time of this function by clock cycles. which is just a simple while loop.
void LK_ADDr(float
*im, float *meanParameter, int
Size
){
while (Size--)
{
*im = *im + *meanParameter;
im++;
meanParameter++;
}
}
the execution time shouldintuitively has a linear relationship with the Size.
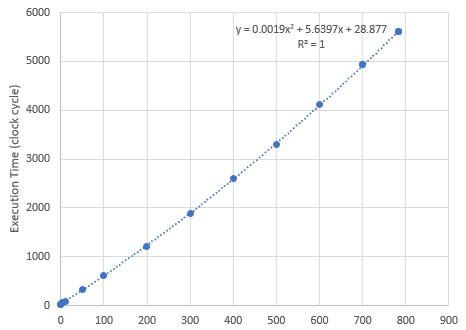
but in test, I've found that it is the square of the Size. The R is eventually equalto 1.

I test the function 10K times for every Size number. And got the average execution time for every Size value. So I'm sure the result I got is correct.
in the trend function, the real constant 28can be explained. which denotes the clock cycles cost by the function, push and pop stack and the parameters loading.
the linear coefficient 5.63 is also explainable, which denotes the clock cycles cost by every loop.
I don't know what's the meaning of the quadratic coefficient.
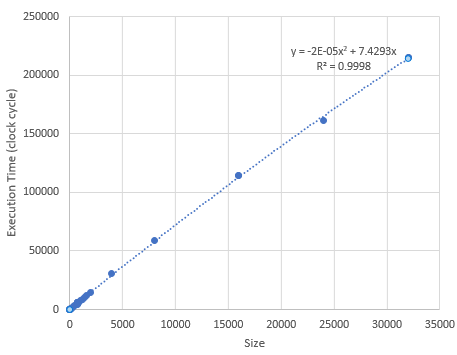
And then I increase the number of size. the quadratic coefficient close to zero the it looks become a linear curve.

But the quadratic coefficient increased from 5 to 7. Does that means the time cost for every loop, increase with the increasing of the size?
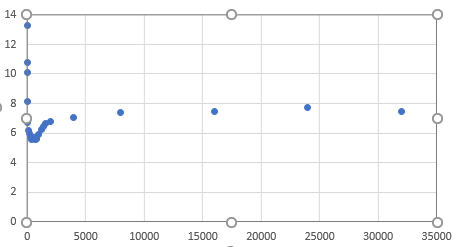
I draw a curve for the quadratic coefficient.

the Y axis means, when I draw the trend curve for the first several points in the first picture, the quadratic coefficient of the trend curve.
it looks interesting. It not due to the FPU because I test the function again but random int data.
so which is not caused by the data too.
I think it may caused by the branch predictor. But the hit rate of branch predictor should over 95%, in this curve, the largest loop time cost has double the smallest one. if it is caused by the branch predictor, it may not a good predictor.
Why the average loop time changed so intensely?
keil arm stm32f7 c jump-bootloader-branch-bx-r0 arm-cortex-m4-cortex-m7-register arm-cortex-m stm32-f- Mark as New
- Bookmark
- Subscribe
- Mute
- Subscribe to RSS Feed
- Permalink
- Email to a Friend
- Report Inappropriate Content
2017-08-30 05:40 AM
Have you disabled the interrupts before calling the function? (systick, etc...)
How about the program and data cache?
- Mark as New
- Bookmark
- Subscribe
- Mute
- Subscribe to RSS Feed
- Permalink
- Email to a Friend
- Report Inappropriate Content
2017-08-30 05:50 AM
Stm32f7 is not a 'simple' processor. There is a cache for reading data. And a buffer for writing-back modified data to memory.
Small data-sets that fit entirely in the cache and buffer will execute more quickly than larger data-sets where the processor has to access slow external memory. The first few writes will seem to take no time at all as the buffer fills up, but subsequent writes can only be made at the speed at which writing back is achieved.
I think this is what leads to your 'bigger-than-trivial data-sets take longer to execute' effect.
But you might claim that the main RAM is single-cycle access. How can access to that RAM be slow?
It might be slow because all your program-fetches also have to come over that same interface e.g. if the data is not in DTCM and the program is not executing from ITCM or ITCM-FLASH. Or if meanParameter happens to be in FLASH.
And if your RAM is external to the microcontroller (e.g. SDRAM) then it will be slow as well.
Also don't forget that stm32f7 is dual-issue, so it can execute two instructions per cycle*, and each one might cause a write to external memory. But it can only write one word per cycle. So even where you're writing to the fastest memory the processor can make data faster than it can write.
*Only one of them can be floating-point I think.
Hope this helps,
Danish
- Mark as New
- Bookmark
- Subscribe
- Mute
- Subscribe to RSS Feed
- Permalink
- Email to a Friend
- Report Inappropriate Content
2017-08-30 07:45 AM
Only a systick interrupt is here. but i don't think it will affect the result. How the data cache influences the result?
- Mark as New
- Bookmark
- Subscribe
- Mute
- Subscribe to RSS Feed
- Permalink
- Email to a Friend
- Report Inappropriate Content
2017-08-30 08:30 AM
,
,
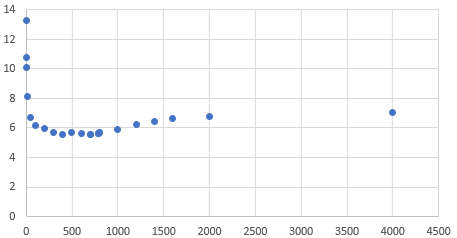
Thanks for your reply, Firstly for the cache, I know it takes less time before the cache is full. But according to My test, the fastest loop is not the first several loop but around 200. See

in the first several points, it is very slowly for every loop.
I'm using the build-in SRAM and all the data has also saved in the SRAM (import before this function)
So there is no extra-component will affect the measurement.
STM32F7 is a dual-issued core but for this function, there is less instruction it can dual-issue. ,
here is the instruction for the loop, Load 2 data and ADD, store back and Sub the size, branch. only STM and SUBS can be dual-issued I think. the only thing can affect the time for every loop is the BCS insturciotn
0x080021A2 E003 , , , ,B , , , , , , , , 0x080021AC
,
, , 85: , , , , , , , , , , , ,*im = *im + *meanParameter,
,
,
, , 86: , , , , , , , , , , , ,im++,
,
,
, , 87: , , , , , , , , , , , ,meanParameter++,
,
,
, , 88: , , , , , ,}
,
,
, , 89: , ,
,
0x080021A4 CA10 , , , ,LDM , , , , , , , ,r2!,{r4}
,
0x080021A6 6803 , , , ,LDR , , , , , , , ,r3,[r0, ♯ 0x00]
,
0x080021A8 4423 , , , ,ADD , , , , , , , ,r3,r3,r4
,
0x080021AA C008 , , , ,STM , , , , , , , ,r0!,{r3}
,
0x080021AC 1E49 , , , ,SUBS , , , , , , r1,r1, ♯ 1
,
, , 83: , , , , , ,while (Size--)
,
,
, , 84: , , , , , ,{
,
,
, , 85: , , , , , , , , , , , ,*im = *im + *meanParameter,
,
,
, , 86: , , , , , , , , , , , ,im++,
,
,
, , 87: , , , , , , , , , , , ,meanParameter++,
,
,
, , 88: , , , , , ,}
,
,
, , 89: , ,
,
0x080021AE D2F9 , , , ,BCS , , , , , , , ,0x080021A4
- Mark as New
- Bookmark
- Subscribe
- Mute
- Subscribe to RSS Feed
- Permalink
- Email to a Friend
- Report Inappropriate Content
2017-08-31 03:50 AM
Lingjun Kong wrote:
I'm using the build-in SRAM
Yes but _which_ SRAM for program?
Is it the ITCM RAM (only 16K big) from 0x00000000 to 0x00003fff? In this case instruction-fetches will not obstruct data-fetches/data-stores
Or the DTCM RAM (128k big) from 0x20000000 to 0x2001ffff? In this case instruction-fetches will initially obstruct data-fetches/data-stores. I think subsequent accesses get cached.
Or SRAM1 / SRAM2 that get accessed over the AXI bus. The documentation is clearer here -
In this case instruction-fetches
willinitially obstruct data-fetches/data-stores and
subsequent accesses get cached.
Lingjun Kong wrote:
and all the data has also saved in the SRAM (import before this function)
Here you could mean DTCM or SRAM1/SRAM2. SRAM1/SRAM2 have a 16k cache shared for instructions and data to get to the bus matrix, but if there's not much DMA going on and AHB is running at the same speed as the processor there shouldn't be a lot of difference.
Lingjun Kong wrote:
the only thing can affect the time for every loop is the BCS insturciotn
Your STM instruction writes to memory. There is only a short buffer for such writes. If you're writing faster than the buffer can be emptied, then the buffer will fill up and then subsequent writes will be slower.
Don't assume that the buffer will be empty when the subroutine starts:
At
subroutine
entry as well as possibly needing to fill the instruction cache, the processor might also have to write-to-stack any registers that are used within the subroutine. And there could be some writes-to-memory in the write buffer that remained from your calling program - unless you did a DSB() before calling your function. These pending writes could slow the execution of the first few loops of your code.These mechanisms are (when viewed from a distance) complicated. If you average out enough times then you can fit a polynomial to your measurements. But I don't think there's much you can learn from this.
Regards,
Danish
- Nucleo-L496ZG-P Issue flashing board in STM32CubeIDE (MCUs)
- STM32H7S78-DK Template XIP external Ram setup bug found in STM32 MCUs Products
- STM32H755 CM4's HAL_Delay() never returns in STM32CubeIDE (MCUs)
- USB damaged (perhaps) after changing biasing source in STM32 MCUs Products
- Ux_DEVICE_HID_CDC_ACM example for the B_U585I-IOT02A in STM32 MCUs Boards and hardware tools