- STMicroelectronics Community
- STM32 MCUs
- STM32 MCUs Products
- How to calculate the worst and the mean execution ...
- Subscribe to RSS Feed
- Mark Topic as New
- Mark Topic as Read
- Float this Topic for Current User
- Bookmark
- Subscribe
- Mute
- Printer Friendly Page
How to calculate the worst and the mean execution time of an assembly instruction in the STM32F103?
- Mark as New
- Bookmark
- Subscribe
- Mute
- Subscribe to RSS Feed
- Permalink
- Email to a Friend
- Report Inappropriate Content
2023-10-13 1:33 AM - edited 2023-10-13 3:04 AM
I have write two simple code examples.
First:
  LDR R0, =0x00000000
  LDR R1, =0x0000FFFF
  LDR R2, =GPIOA_ODR

  turnON:
  STR R1, [R2]
  turnOFF:
  STR R0, [R2]
  delayDone:
  B turnON
Second:
  LDR R0, =0x00000000
  LDR R1, =0x0000FFFF
  LDR R2, =GPIOA_ODR

  turnON:
  STR R1, [R2]
  B turnOFF
  turnOFF:
  STR R0, [R2]
  delayDone:
  B turnON
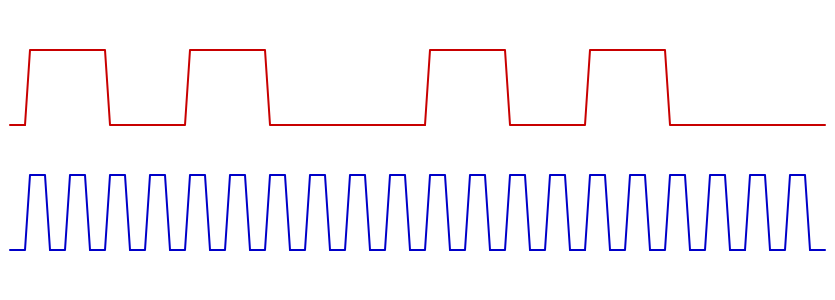
The first example cause next output:
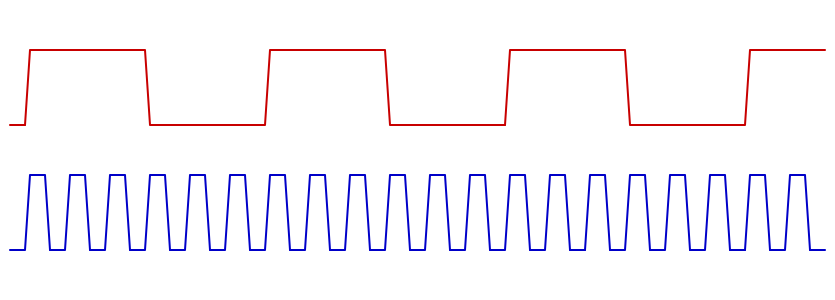
The second example cause next output:
The first example gives a 2-2-2-4 clock bitbang sequence. Respectively we can say that
the best loop execution time is 4 cycles,
the mean loop execution time is 5 cycles,
the worst loop execution time is 6 cycles.
And the second example gives a 3-3-3-3 clock bitbang sequence. Respectively we can say that
the best loop execution time is 6 cycles,
the mean loop execution time is 6 cycles,
the worst loop execution time is 6 cycles.
I understand that this behaviour cause is the branch prediction.
Is it possible to calculate/simulate for some code (such as a macro or a procedure) writed with assembly instructions the worst execution time?
- Labels:
-
STM32F1 Series
- Mark as New
- Bookmark
- Subscribe
- Mute
- Subscribe to RSS Feed
- Permalink
- Email to a Friend
- Report Inappropriate Content
2023-10-23 1:13 PM
You should be able to use DWT CYCCNT to count cycles. You could perhaps post-process the .LST file and have it estimate instruction timings.
The F1 doesn't cache the FLASH. Trying to remember if the Write Buffers on the CM3 are one or two words deep, the AHB write is of the order of four cycles as I recall.
Could try aligning the branch targets, and unwinding the loops a little.
Up vote any posts that you find helpful, it shows what's working..
- SBSFU stm32h753zi in STM32 MCUs Security
- Delay between HAL_ADCEx_Calibration_Start and HAL_ADC_Start_DMA required for unknown reason in STM32 MCUs Embedded software
- STM32U545 Execution Speed Slower Than Expected in STM32 MCUs Products
- Problem installing STM32CubeProgrammer on a debian in STM32CubeProgrammer (MCUs)
- Stm32H750 bootloader - Failure when jumping to application in STM32 MCUs Products