- STMicroelectronics Community
- STM32 MCUs
- STM32 MCUs Products
- Re: Debugger doesn't halt at main()
- Subscribe to RSS Feed
- Mark Topic as New
- Mark Topic as Read
- Float this Topic for Current User
- Bookmark
- Subscribe
- Mute
- Printer Friendly Page
Debugger doesn't halt at main()
- Mark as New
- Bookmark
- Subscribe
- Mute
- Subscribe to RSS Feed
- Permalink
- Email to a Friend
- Report Inappropriate Content
2016-12-29 09:03 PM
Hi,
I am using STM32F4xx based custom board and IAR as an IDE for development. Till now everything works fine, but after adding few lines of code the debugger has stopped working i.e. it is not halting at main(). I am not able to understand what is the problem.
After removing the few lines of code that I added, it started working correctly!! Without change it downloads 560521 bytes into the FLASH and with change it downloads 560527 bytes. So there is not a big difference.
Can someone please help me here?
Appreciate your quick reply.
Thanks,
Dhaval
- Mark as New
- Bookmark
- Subscribe
- Mute
- Subscribe to RSS Feed
- Permalink
- Email to a Friend
- Report Inappropriate Content
2016-12-29 11:48 PM
Is it getting to main?
I expect it is calling SystemInit first, perhaps it is stuck waiting for a clock, or you have some code which expects the static initialization to have occurred.
When you stop the debugger where is it stuck? The Hard Fault Handler?
Up vote any posts that you find helpful, it shows what's working..
- Mark as New
- Bookmark
- Subscribe
- Mute
- Subscribe to RSS Feed
- Permalink
- Email to a Friend
- Report Inappropriate Content
2016-12-30 10:33 PM
Yes, I know it first goes to SystemInit() function and then jumps to main(). And when I stopped the debugger, it is showing some unknown location, neither in the SystemInit() nor in Hard Fault Handler!!
Also, AFAIK there was no static initialization on which the code is waiting. That is why I am bit confused, whether this is due to code size or what? This is really a blocking issue for me.
Looking forward to your quick reply.
- Mark as New
- Bookmark
- Subscribe
- Mute
- Subscribe to RSS Feed
- Permalink
- Email to a Friend
- Report Inappropriate Content
2016-12-30 11:37 PM
Then don't get hung up on it being a code size issue, and focus in figuring out where it is. Look at a full disassembly and code surrounding where it is stuck.
Make sure the linker script, icf, or whatever correctly describes the part being used.
Turn off run to main, and step into failure.
Up vote any posts that you find helpful, it shows what's working..
- Mark as New
- Bookmark
- Subscribe
- Mute
- Subscribe to RSS Feed
- Permalink
- Email to a Friend
- Report Inappropriate Content
2016-12-31 02:53 AM
,
,
Hi Clive,
Thanks for your quick reply.
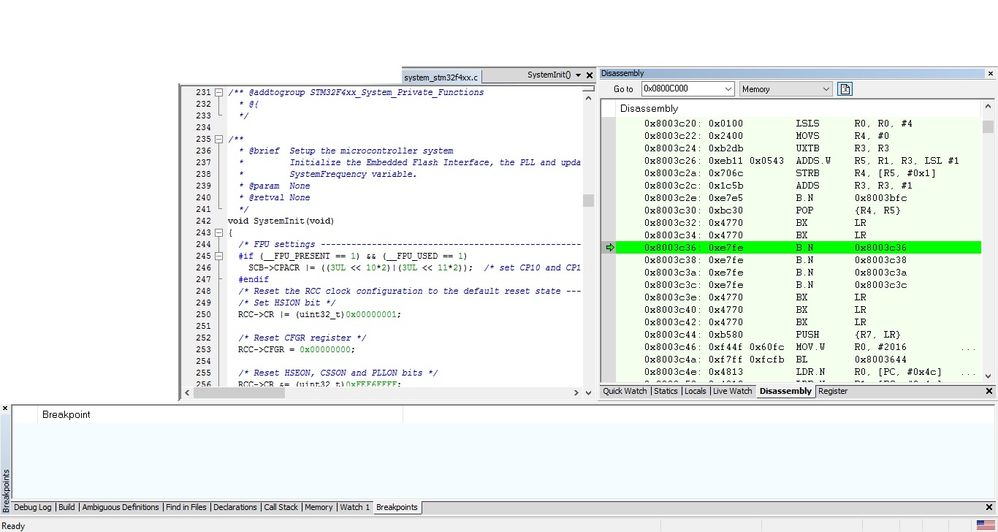
I have tried to debug it as you have suggested. I have disabled the 'Run to main()' option and then start debugging. Debugger stops at ''LDR , , R0, =SystemInit'' first. Then I single step and it goes to 'SystemInit()' function. And immediately after entering into the function it hung at following line:
/* FPU settings ------------------------------------------------------------*/
,
♯ if (__FPU_PRESENT == 1) &,&, (__FPU_USED == 1),
SCB->,CPACR |= ((3UL <,<, 10*2)|(3UL <,<, 11*2)), /* set CP10 and CP11 Full Access */,
♯ endifFollowing is the snapshot of the disassembly, when it was hung.

Please help me to resolve this.
Thanks,
Dhaval
- Mark as New
- Bookmark
- Subscribe
- Mute
- Subscribe to RSS Feed
- Permalink
- Email to a Friend
- Report Inappropriate Content
2016-12-31 09:10 AM
These are things that are hard to debug remotely, with minimal information.
I suspect this isn't the initial code being run on the processor, that you have some boot-loader or RTOS running and this is application code you have transferred control too.
You should look at the infinite loop in the context of the boot-loaders memory map and symbols.
Couple of possibilities, it is faulting due to being in a 'user' context, or there is an FPU error it is signalling.
I would suggest you copy the SCB->VTOR setting for the application before setting SCB->CPACR, ie copy the VTOR code from the end of SystemInit() to the front. This way the fault will vector into the symbols space of the application, and something you can see more readily in the debugger.
Up vote any posts that you find helpful, it shows what's working..
- NucleoF303RE PWM on TIM3 (PA6) Not Working – No Output Signal in STM32 MCUs Embedded software
- Log Values from STM32H747IGTX M7 Core on PuTTY in STM32CubeIDE (MCUs)
- SysTick not incrementing with TrustZone enabled in STM32 MCUs Embedded software
- NMI Fault without any obvious fault bits set in STM32 MCUs Embedded software
- USB-3300 Not detected by windows on Nucleo H755ZIQ in STM32 MCUs Embedded software