- STMicroelectronics Community
- STM32 MCUs
- STM32 MCUs Boards and hardware tools
- Re: HardFault_Handler() at stm32f0xx_it.c occur wh...
- Subscribe to RSS Feed
- Mark Topic as New
- Mark Topic as Read
- Float this Topic for Current User
- Bookmark
- Subscribe
- Mute
- Printer Friendly Page
HardFault_Handler() at stm32f0xx_it.c occur when i run a project with RTOS.
- Mark as New
- Bookmark
- Subscribe
- Mute
- Subscribe to RSS Feed
- Permalink
- Email to a Friend
- Report Inappropriate Content
2024-04-11 7:06 PM
Dear STM support team.
My name is Dai. I am working at G-innovation Corporation.
Now I have a project using the STM Chip(STM32F0xx).
I use the STM32CubeMX (version 6.11.0) to create a project using the STM32F091VBT6 with CMIS_RTOS.
this project aims to study all CMSIS-RTOS APIs.
the function of the project include:
- 6 thread: "idle thread" to blink an LED at 0.5Hz.
"SWI thread: is reserved.
"dut1 thread" to send counter log to the PC over UART1, "dut2 thread", "dut3 thread" and "dut4 thread" as the same "dut1 thread".
mutex to protect the "debug_printf" function.
I received a "HardFault_Handler() at stm32f0xx_it.c 0x80033f4" after running it for several milliseconds.
I have attached my project, the UART log, and the Debug log to this post.
everybody helps me to debug and fix this bug.
Regards,
Solved! Go to Solution.
- Labels:
-
STM32F0 Series
Accepted Solutions
- Mark as New
- Bookmark
- Subscribe
- Mute
- Subscribe to RSS Feed
- Permalink
- Email to a Friend
- Report Inappropriate Content
2024-04-16 7:29 PM
I discovered that when I increased the size of the Stack of Thread this Problem was resolved.
Everybody tells me how to check the stack's size during run time.
Regards!
- Mark as New
- Bookmark
- Subscribe
- Mute
- Subscribe to RSS Feed
- Permalink
- Email to a Friend
- Report Inappropriate Content
2024-04-14 7:58 PM
Can everybody help me?
- Mark as New
- Bookmark
- Subscribe
- Mute
- Subscribe to RSS Feed
- Permalink
- Email to a Friend
- Report Inappropriate Content
2024-04-16 7:29 PM
I discovered that when I increased the size of the Stack of Thread this Problem was resolved.
Everybody tells me how to check the stack's size during run time.
Regards!
- Mark as New
- Bookmark
- Subscribe
- Mute
- Subscribe to RSS Feed
- Permalink
- Email to a Friend
- Report Inappropriate Content
2024-04-17 3:53 AM - edited 2024-04-17 3:55 AM
Hi,
You can always check the stack usage in the freeRTOS runtime statistics.
Secondly, there is also this freeRTOS function that you can consider using: uxTaskGetStackHighWaterMark()
I hope this helps.
- Mark as New
- Bookmark
- Subscribe
- Mute
- Subscribe to RSS Feed
- Permalink
- Email to a Friend
- Report Inappropriate Content
2024-04-18 11:53 PM - edited 2024-04-19 2:37 AM
Hi @bashira
thanks for your support!
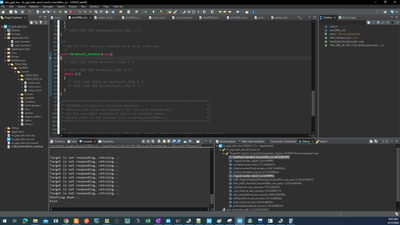
But when I use the STM32CUBEIDE to check the stack usage in the freeRTOS runtime statistic, all parameters in the "Run time(%)" cell show N/A. Please tell me why and how to show it. the SIM32CUBEIDE version on my PC is 1.15.0
Best Regard!
- Mark as New
- Bookmark
- Subscribe
- Mute
- Subscribe to RSS Feed
- Permalink
- Email to a Friend
- Report Inappropriate Content
2024-04-21 5:23 AM - edited 2024-04-21 5:25 AM
Hello Dai,
Sorry for the delay.
There are a couple of things you can do. The first step is:
Click the button here.
Then additionally you can go into freeRTOS settings and enable a few things.
1. Generate Runtime Stats.
2. Check for stack overflow. (This hook has saved me so much headaches over the years)
3. Also enable stack high address.
Don't ask me about the runtime %. No idea :) Never used it.
EDIT: You need to set a break point somewhere in your code to see the stats being updated.
- Mark as New
- Bookmark
- Subscribe
- Mute
- Subscribe to RSS Feed
- Permalink
- Email to a Friend
- Report Inappropriate Content
2024-04-21 8:32 PM
Thanks for your support, it is helpful for me.
I have a new problem.
the "Build Analysis" windows of the STM32CubeIde show nothing. how do I get information about my build?
Regards
Dai Huy
- Mark as New
- Bookmark
- Subscribe
- Mute
- Subscribe to RSS Feed
- Permalink
- Email to a Friend
- Report Inappropriate Content
2024-04-21 10:42 PM
Hello,
Please open a new thread for this new question.
Thank you for your understanding.
- Mark as New
- Bookmark
- Subscribe
- Mute
- Subscribe to RSS Feed
- Permalink
- Email to a Friend
- Report Inappropriate Content
2024-04-21 11:56 PM
Thank you for informing me.
- STM32CubeIDE: Application Strucutre is stuck to Advanced in STM32CubeIDE (MCUs)
- Is STM32G474 Compatible with STM32F334 For Average CM Buck-Boost Application? in STM32 MCUs Products
- No DSI dev kits with CubeMX project? Surely not possible... in STM32 MCUs Products
- AZURE RTOS Support H7S3 in STM32CubeIDE (MCUs)
- Need Help with Using Wi-Fi on STWINBX1 and Sending Notifications to MQTTX Server in STM32 MCUs Wireless


