- STMicroelectronics Community
- STM32 MCUs Software development tools
- STM32CubeMonitor (MCUs)
- Re: STM32CubeMonitor is live.
- Subscribe to RSS Feed
- Mark Topic as New
- Mark Topic as Read
- Float this Topic for Current User
- Bookmark
- Subscribe
- Mute
- Printer Friendly Page
STM32CubeMonitor is live.
- Mark as New
- Bookmark
- Subscribe
- Mute
- Subscribe to RSS Feed
- Permalink
- Email to a Friend
- Report Inappropriate Content
2020-03-04 6:14 AM
The new STM32CubeMonitor software tool from STMicroelectronics displays runtime variables of STM32 applications in real time while enabling developers to customize the graphical visualization in their OS environment of choice (Windows®, Linux, or MacOS®).
You can find the presentation and software at : www.st.com/stm32cubemonitor
The reference documentation and setup instructions are available in stm32mcu wiki : https://wiki.st.com/stm32mcu/wiki/STM32CubeMonitor:STM32CubeMonitor_overview
If you have questions or want to share feedback, please post in this forum, and set the tag STM32CubeMonitor.
Solved! Go to Solution.
- Labels:
-
STM32CubeMonitor
Accepted Solutions
- Mark as New
- Bookmark
- Subscribe
- Mute
- Subscribe to RSS Feed
- Permalink
- Email to a Friend
- Report Inappropriate Content
2020-03-11 8:12 AM
For new questions or feedback, please create a new post with the tag STM32CubeMonitor.
It will be easier to sort information and to put answers.
Thank you
Stephane
- Mark as New
- Bookmark
- Subscribe
- Mute
- Subscribe to RSS Feed
- Permalink
- Email to a Friend
- Report Inappropriate Content
2020-03-07 8:51 AM
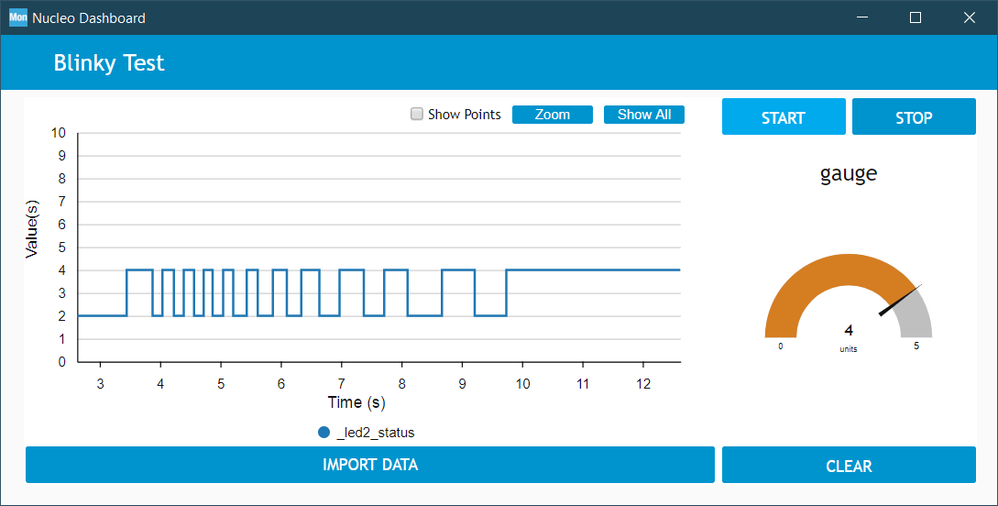
Made a simple "blinky monitor", and I'm impressed with the tool. I've previously used UART -> Serial plotter to plot my graphs. I will definitely use this tool in future projects.
Some things I'm missing (based on a few hours of experimentation):
- Seperate projects / project manager. I see a library option in the export view, but Ideally I'd like to just save and load the dashboard from my local disk. It seem like this opion is currently hidden under the "export/import" option, but save/open would make more sense to me as a user.
- An "open in browser" option. The dashboards can also be opened in a browser, but I need to check the wiki everytime to check which port I exactly need.
- A lanch from explorer option. If I want to share a dashboard with a colleage, the current workflow is: launch monitor -> export json -> share json -> lanch monitor -> import json -> deploy -> launch dashboard. Having a "launch" file changes this to: share lanch+json file -> double click launch file and the dashboard opens. In most cases my colleague would not be intersted in how the dashboard is developed, but simply wants to monitor the data coming in from the ST-Link. A launch file would make sharing dashboards much easier (and more user friendly).
- Option to remove the "Import data" on the STMicroelectronics chart node. Make this input a topic instead, so the user can add a button to import the data if desired. An option/topic to export visible and all data plotted in the chart would also be useful, as this makes logging of certain events easier. (I did notice a storage node, but if I understood that correctly, that seems to be a continuous write, which is not always needed)
- Better documentation. The wiki is very sparse in its documentation. A PDF with a simple walkthrough would be greatly appreciated.
- Better documentation of the impact on the microcontroller when using the monitor tool. The webnair mentioned that there is no impact, since it uses the debug interface, but stating that in your documentation would greatly be appreciated.
- WISIWYG dashboard development. This has low priority, but designing the dashboard is currently very much a guessing game and adjusting numbers and nodes until the desired layout is reached. A GUI drag-and-drop interface would speedup GUI development.
I'm looking forward to future updates. And @stephane.legargeant , kudus to the development team: this is indeed a useful tool.
- Mark as New
- Bookmark
- Subscribe
- Mute
- Subscribe to RSS Feed
- Permalink
- Email to a Friend
- Report Inappropriate Content
2020-03-07 11:08 AM
Video:
I think it would help in the presentation video to start from a board setup (PC => STLink => STM32 Nucleo 64 with maybe User button, LED and ADC + DAC simple view.
Show STLinkV2, V2,1, V3, V3mini as compatible probes.
Then show an IDE with user main code
Show that when a project is built, there is a BIN and an ELF debug file which contains all labels and addresses setup by linker.
Show now IDE debug mode and live watch window.
Then show the graphical version using CubeMonitor of the equivalent live watch variables
==> This would probably help understand faster the main features of cubemonitor in less than 3 minutes, before spending 52 minutes on the webinar showing the features. Although a step by step doc would help.
CubeMonitor works when SWD is available (not in level 2). It does not require additional Flash/RAM as it uses debug interface.
Live watch means the debug interface use say SWD to read/write the internal memory of the STM32. It's a memory read or write bus cycle to "probe" the data, so it's nearly transparent. Some variables intended to be "watched" should be enforced volatile if there is a data cache, a slight alteration of user code in F7/H7 fanilies.
It would be great to monitor the stack pointer to grab over time a rough value of the real stack depth.
- Mark as New
- Bookmark
- Subscribe
- Mute
- Subscribe to RSS Feed
- Permalink
- Email to a Friend
- Report Inappropriate Content
2020-03-07 12:10 PM
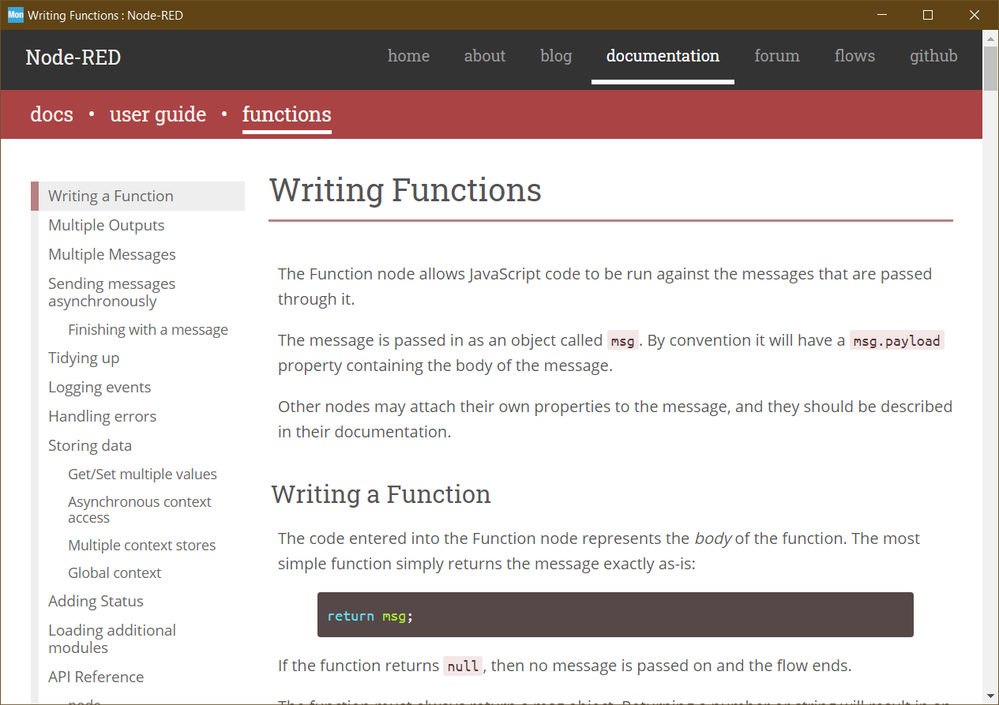
I may have come across a bug: I launched the documentation window by clicking on the "function" node => information => details => "online documentation" link. Whenever that's open, I am unable to launch the dashboard by clicking the "dashboard button.
- Mark as New
- Bookmark
- Subscribe
- Mute
- Subscribe to RSS Feed
- Permalink
- Email to a Friend
- Report Inappropriate Content
2020-03-09 10:23 AM
Hello AShri.1
You are right, when the online help is open, the dashboard should be displayed, but it is not.
I can suggest 2 workaround :
- Close the help windows and then the dashboard will open.
- Open the tool inside Chrome ( http://127.0.0.1:1880/), and you will be able to open help and dashboard at the same time.
Best regards
Stephane
- Mark as New
- Bookmark
- Subscribe
- Mute
- Subscribe to RSS Feed
- Permalink
- Email to a Friend
- Report Inappropriate Content
2020-03-09 10:33 AM
Thanks a lot for the feedback, it is very interesting for us.
Some answers to your points :
- For the "open in browser", I have added a bookmark in my browser, you can also create a shortcut.
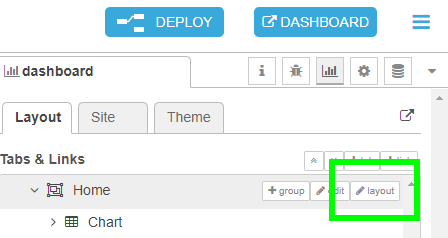
- For the WISIWYG, there is a layout editor for the dashboard. It is accessible in the dashboard tab, in the Tabs & Link area :
- We plan to add new pages in the wiki, and we will study the other points.
Best regards
Stephane
- Mark as New
- Bookmark
- Subscribe
- Mute
- Subscribe to RSS Feed
- Permalink
- Email to a Friend
- Report Inappropriate Content
2020-03-11 8:12 AM
For new questions or feedback, please create a new post with the tag STM32CubeMonitor.
It will be easier to sort information and to put answers.
Thank you
Stephane
- STM32CubeIDE 1.18.0 live expressions stopped working completely in STM32CubeIDE (MCUs)
- STM32CubeMonitor on Mac not usable in STM32CubeMonitor (MCUs)
- STM32CubeMonitor-RF V2.17.0 is available in STM32CubeMonitor (MCUs)
- STM32CubeMonitor 1.10.0 is available in STM32CubeMonitor (MCUs)
- Error: Region Flash of context Boot and region Flash of context Appli are overlapped. in STM32CubeMX (MCUs)


