- STMicroelectronics Community
- STM32 MCUs Software development tools
- STM32CubeIDE (MCUs)
- debug with stm32cubeIDE? "Program received signal ...
- Subscribe to RSS Feed
- Mark Topic as New
- Mark Topic as Read
- Float this Topic for Current User
- Bookmark
- Subscribe
- Mute
- Printer Friendly Page
debug with stm32cubeIDE? "Program received signal SIGTRAP, Trace/breakpoint trap."
- Mark as New
- Bookmark
- Subscribe
- Mute
- Subscribe to RSS Feed
- Permalink
- Email to a Friend
- Report Inappropriate Content
2020-08-17 7:40 PM
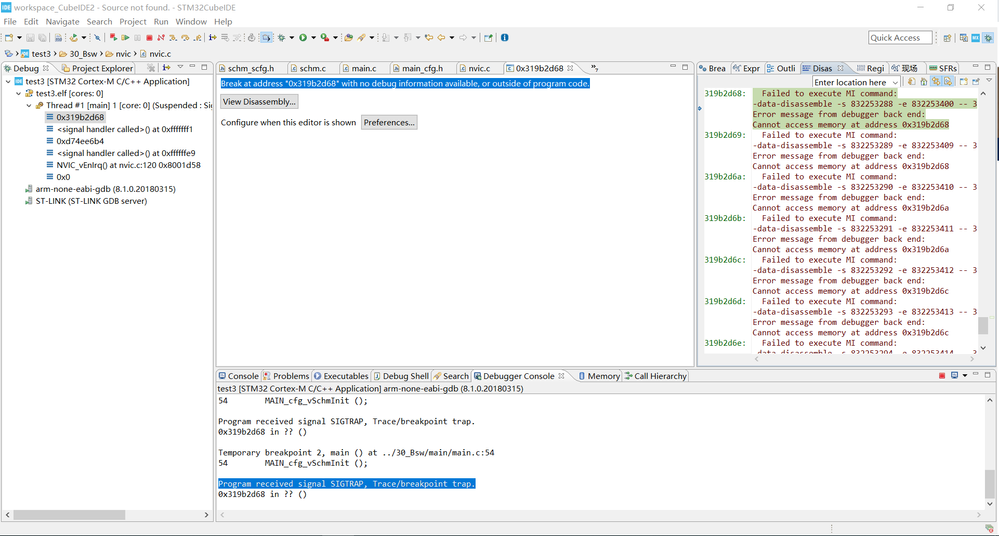
when I debug the stm32G474 with CubeIDE, the following errror always happen,
and the code can run normally on keil. I really don't kown what problem?
"Break at address "0x319b2d68" with no debug information available, or outside of program code."
- Labels:
-
Debug
-
STM32CubeIDE
-
STM32G4 Series
- Mark as New
- Bookmark
- Subscribe
- Mute
- Subscribe to RSS Feed
- Permalink
- Email to a Friend
- Report Inappropriate Content
2020-08-18 12:54 AM
It looks strange. I assume you do not have any code/data located at 0x319b2d68,
Is the linker script correct?
Do you use ST-LINK GDB server or OpenOCD for debugging?
Both these gdbservers are included in STM32CubeIDE and you can try the other one by selecting it in the Debug Configuration.
What is the gdbserver logging when you try to debug?
You can also try to remove all breakpoints, see Breakpoints view, before starting debugging.
Please also try to create a new empty project for STM32G474 and try to debug this. If it works then please compare the linker script between this empty project with your project.
The STM32CubeIDE User manual is also a good reference, it is available here:
- How is Gprof editor supposed to work in STM32CubeIDE? in STM32CubeIDE (MCUs)
- Not possible to Run/Debug on the evaluation board STM32F446RE Nucleo-64 in STM32CubeIDE (MCUs)
- STM32CubeIDE installation issues in STM32CubeIDE (MCUs)
- Could not verify ST device when attempting to debug in STM32CubeIDE (MCUs)
- "Could not verify ST device" when Debugging with RTOS Proxy; OK without in STM32CubeIDE (MCUs)
