- STMicroelectronics Community
- STM32 MCUs Software development tools
- STM32CubeIDE (MCUs)
- Re: CubeMX debugger crashes/exists/quits automatic...
- Subscribe to RSS Feed
- Mark Topic as New
- Mark Topic as Read
- Float this Topic for Current User
- Bookmark
- Subscribe
- Mute
- Printer Friendly Page
CubeMX debugger crashes/exists/quits automatically on certain lines
- Mark as New
- Bookmark
- Subscribe
- Mute
- Subscribe to RSS Feed
- Permalink
- Email to a Friend
- Report Inappropriate Content
2023-11-09 01:58 AM
Hi,
I am working with what I think is the latest STM cubeMX:
But, I am hitting an issue contantly that during debugging, on certain "lines of code" the debugger hits some unexpected condition, and then decides to exit, automatically stopping the debugging perspective.
I get it that gdb sometimes gives errors, but letting openOCD completely quit upon error is a bit extreme and pretty annoying since the entire debug context is lost.
In the debugger window, I simply see this popping up just before:
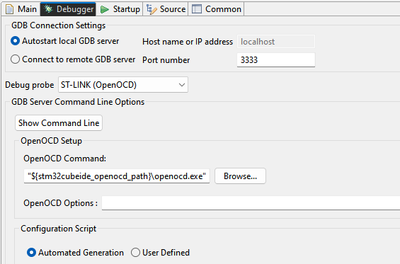
My debug settings are this:
And it -very specifically- happens when stepping in certain parts of the code. Presumably GDB tries to read some variable that it cannot access, or tries to disassemble some code, Idk, but in any case, the debugger fully quites
I can't imagine that nobody else hasn't bumped into this yet?
Kind regards,
Arnout
- Mark as New
- Bookmark
- Subscribe
- Mute
- Subscribe to RSS Feed
- Permalink
- Email to a Friend
- Report Inappropriate Content
2023-11-09 02:08 AM
So I quickly tried some things:
- Ran openOCD in seperate window => But it doesn't seem to be openOCD that is the problem
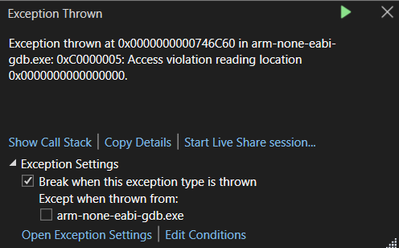
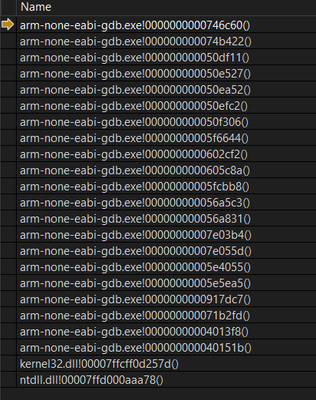
- Attached to arm-none-eabi-gdb.exe through visual studio and checked for execeptions:
GDB indeed crashes
I have no symbol information of the gdb build. But it's clear that the shipped GDB has issues, .. and crashes when stepping through certain lines of code!
- Mark as New
- Bookmark
- Subscribe
- Mute
- Subscribe to RSS Feed
- Permalink
- Email to a Friend
- Report Inappropriate Content
2023-11-09 02:10 AM
Just to be clear, this is the version that cubeMX shipped, and has the issue:
C:\ST\STM32CubeIDE_1.13.2\STM32CubeIDE\plugins\com.st.stm32cube.ide.mcu.externaltools.gnu-tools-for-stm32.11.3.rel1.win32_1.1.1.202309131626\tools\bin\arm-none-eabi-gdb.exe --version
GNU gdb (GNU Tools for STM32 11.3.rel1.20230912-1600) 12.1.90.20220802-git
- Mark as New
- Bookmark
- Subscribe
- Mute
- Subscribe to RSS Feed
- Permalink
- Email to a Friend
- Report Inappropriate Content
2023-11-09 06:16 AM
I ended up replacing C:\ST\STM32CubeIDE_1.13.2\STM32CubeIDE\plugins\com.st.stm32cube.ide.mcu.externaltools.gnu-tools-for-stm32.11.3.rel1.win32_1.1.1.202309131626\tools\bin\arm-none-eabi-gdb.exe --version with the one from https://developer.arm.com/downloads/-/gnu-rm (gcc-arm-none-eabi-10.3-2021.10-win32.exe) and the crashes went away ...
- Mark as New
- Bookmark
- Subscribe
- Mute
- Subscribe to RSS Feed
- Permalink
- Email to a Friend
- Report Inappropriate Content
2023-11-10 08:48 AM
no you are not the only one. I confirm the bug and was bugging me for a while. I am not used to complain, I also had a huge problem with ITCM / SRAM breakpoints that ST toolchain couldn't resume. that was because it uses soft breakpoints, hard breakpoints where fine, but there is no tick box to disable software breakpoints so...
anyway about this issue in my case the application runs correctly disassembly view was crashing the gdb. since you got me curious I tried to install the latest toolchain from "https://developer.arm.com/Tools%20and%20Software/GNU%20Toolchain". ARM GNU Toolchain 13.2Rel1 (not the embedded one)
I cannot compile with that toolchain because it increases the binary output significantly and it doesn't fit my flash anymore.
however, I tried to replace the only the gdb executable and it actually works as you suggested!
my CPU is a cortex-M7, maybe the gdb toolchain build made by ST is not 100% correct. additionally it does not happen every time, it happens with very specific areas of the code. and when it start happening there is no retry that works, it will keep crashing at such given breakpoint or when using step-by-step.
it seems to be connected with the disassembly panel. in certain cases I just close that panel and may continue. I naively think there is a race condition between multiple debug services because I can see that in some cases the disassembly does not decode a portion of my code maybe one instruction or two (for the people who wonder, the code runs perfectly fine), and it seems like there is a low level issue. guess what? the ARM toolchain does not have any of these issues, I will check it thoroughly though and will post here sometime in the future
- Mark as New
- Bookmark
- Subscribe
- Mute
- Subscribe to RSS Feed
- Permalink
- Email to a Friend
- Report Inappropriate Content
2023-11-10 08:50 AM
side note, you should not mention CubeMX, CubeIDE is better title. people may not answer or get confused
- Mark as New
- Bookmark
- Subscribe
- Mute
- Subscribe to RSS Feed
- Permalink
- Email to a Friend
- Report Inappropriate Content
2023-11-22 07:59 AM
for people that check this thread, it would be useful to clarify that the SWD link has several parts, the target, the host software, STLINK, gdbserver, the USB cable etc...
if the JTAG/SWD misbehaves it does not translate automatically it is the STLINK to blame.
So here I provide a hint:
try to disable your low power features or fancy debug gadgets when you have JTAG problems.
Reasoning:
most times bad CPU configuration will predictably kill your SWD but not always, it can also cause conflicts with the STM tools when they are attempting to access the CPU, this is even more obvious when the host cannot use "connect under reset" and that means the CPU is running normally while the SWD/JTAG is trying to identify the CPU, configure the debug subsystems and establish a debug link. if you mess with the CPU at the same time it may cause side effects on the debugger. if you are unlucky a JTAG crash will appear all of a sudden after many days of normal work. obviously "connect under reset" mitigates most problems, but is not always possible to use that.
it could also be that the CPU configuration is wrong, if it is unstable it is more likely that your software is interfering with the external equipment. this happens when:
1) you change the voltage supply configuration (some CPU have this), the supply can also be external as a switching or PMIC etc... so, this depends on your board + CPU
2) entering sleep or deep sleep may affect both JTAG/SWD and your trace tools like ITM/DWT. the same way it may affect any peripheral or driver until correctly configured
3) change CPU clock may interfere with ITM when deriving the clock from the CPU, this is CPU family dependent
4) some CPU have clock gating / low power modes / clock configurations that may affect debugging when not setup correctly, the SDK and manuals are not always explicitly telling you all side effects of some given configuration and most of the time you may need to guess or abstract the consequences on your debugging tools. thing is I have seen configurations that may cause bad behaviour in rare cases. for example you can turn off the clock for some components that are used by the STLINK during detection and initial configuration and this is totally undocumented, the fact is, I believe there are dozens of components the JTAG/SWD is accessing, some are part of the CPU, some are part of the SoC like DBGMCU.
5) when you activate the DWT, ITM or other CPU gadgets you shall be very careful on how you manipulate some control registers. an example would be:
CoreDebug->DEMCR = CoreDebug_DEMCR_TRCENA_Msk; // enable trace in core debug
DBGMCU->CR = 0x700000; // enable debug clocks
DWT->CYCCNT = 0; // reset the counter
DWT->CTRL = DWT_CTRL_CYCCNTENA_Msk; // enable the counter
should be instead:
CoreDebug->DEMCR |= CoreDebug_DEMCR_TRCENA_Msk; // enable trace in core debug
DBGMCU->CR |= 0x700000; // enable debug clocks
DWT->CYCCNT = 0; // reset the counter
DWT->CTRL |= DWT_CTRL_CYCCNTENA_Msk; // enable the counter
note the operator |= instead of the = operator, these registers can be manipulated also by gdb
6) check the errata sheet for both core and STM :)
7) security features may change JTAG/SWD behaviour, your launch configuration may need to adapt. in some cases your bootloader should also help when SWD is allowed but running with security features on; for example you cannot connect under reset anymore, and other connections may have timing issues, so you may want to setup the cpu / clocks and then busy wait for the SWD to connect (with timeout). this delay helps to have a more stable connection, of course this is just theory, I am not recommending any specific processing here because the least you do the safer you are since any DBGMCU / DWT / CoreDebug etc... register access increase the chance of STLINK conflict.
8 ) you are hitting a UNPREDICTABLE configuration or condition because of a driver bug. usually if you do your own driver you must read carefully the manual and understand how to process registers. this also applies to the Cortex-M which has it's own manual and most people don't even read. I suspect not even those that produce well known public RTOS as I have spotted bugs on those too. beware that most online software are not a very good reference. if you mess with clock is very likely you want to use the SDK, clock handling are a minefield of these conditions.
9) GPIO incorrect or unsafe config manipulation even if it is temporary or done just during init. also clock disable of the GPIO (usually port A and B) may also affect, so if you reference count your port usage just remember to include JTAG/SWD pins or you may end up disabling clocks too soon.
GPIO init from STM32CubeMX seems fine; some people find it a bit simplistic and end up doing their own gpio driver.
I am sure there are more, is impossible to do an exhaustive list as there are many CPU families and each may have important differences. but you got the idea, there are several things that are user responsibility.
I am quite sure that clock, power and CPU configurations are just the most obvious causes (on the firmware side) of your JTAG malfunction.
it can also be a bad solder, bad connector, bad flat, bad STLINK, bad driver, bad laptop, bad USB cable / USB hub / USB port. once you checked everything it is likely your JTAG will behave. once you have done these you may want to investigate the gdbserver too as ArnoutDekimo pointed out it can also be a weak point in the link.
in the meantime we hope ST will keep working on their STLINK and improve the reliability and user messages, it is known far from trivial to achieve a high quality SWD gadget that support all modern CPUs.
I keep using the ARM toolchain gdb as it is slightly more reliable with the disassembly view for unknown reasons.
- Virtual COM Port Not Working on NUCLEO-H755? in STM32CubeMX (MCUs)
- Need Help Validating FDCAN Code: Unable to Read RxData in Live Expressions Debug in STM32CubeIDE (MCUs)
- STM32N6570-DK: Cannot erase external Flash in STM32CubeProgrammer (MCUs)
- STM32F469I-DISCO Missing fatfs.h after using CubeMX to Generate Code in STM32CubeMX (MCUs)
- Login issue within the IDE in STM32CubeIDE (MCUs)


