- STMicroelectronics Community
- STM32 MCUs
- STM32 MCUs TouchGFX and GUI
- STM32F746GDISCOVERY and TouchGFX 4.13 problem
- Subscribe to RSS Feed
- Mark Topic as New
- Mark Topic as Read
- Float this Topic for Current User
- Bookmark
- Subscribe
- Mute
- Printer Friendly Page
STM32F746GDISCOVERY and TouchGFX 4.13 problem
- Mark as New
- Bookmark
- Subscribe
- Mute
- Subscribe to RSS Feed
- Permalink
- Email to a Friend
- Report Inappropriate Content
2020-02-26 2:18 AM
Hi to all i have this problem, i create a simpe example with TouchGFX Designer 4.13, i use the STM32F746GDISCOVERY for my test.
I create the esample and i see all work well because i run simulator and run target all work well.
I generate the code, i open the project with CubeIde 1.3 and in folder ..Middlewares\ST\touchgfx copy the files present in TouchGFX folder,
If i build the project i don't have error this is the output:
11:11:51 **** Incremental Build of configuration Debug for project STM32F746G_DISCO ****
make -j8 all
arm-none-eabi-size STM32F746G_DISCO.elf
text data bss dec hex filename
44976 192 9812 54980 d6c4 STM32F746G_DISCO.elf
Finished building: default.size.stdout
11:12:14 Build Finished. 0 errors, 0 warnings. (took 22s.711ms)
if i run the debug i have this error:
STMicroelectronics ST-LINK GDB server. Version 5.5.0
Copyright (c) 2019, STMicroelectronics. All rights reserved.
Starting server with the following options:
Persistent Mode : Disabled
Logging Level : 1
Listen Port Number : 61234
Status Refresh Delay : 15s
Verbose Mode : Disabled
SWD Debug : Enabled
InitWhile : Enabled
Waiting for debugger connection...
Debugger connected
-------------------------------------------------------------------
STM32CubeProgrammer v2.4.0
-------------------------------------------------------------------
ST-LINK SN : 0676FF535651727067074056
ST-LINK FW : V2J36M26
Voltage : 3.20V
SWD freq : 4000 KHz
Connect mode: Under Reset
Reset mode : Hardware reset
Device ID : 0x449
Device name : STM32F74x/STM32F75x
Flash size : 1 MBytes
Device type : MCU
Device CPU : Cortex-M7
Memory Programming ...
Opening and parsing file: ST-LINK_GDB_server_a20696.srec
File : ST-LINK_GDB_server_a20696.srec
Size : 44728 Bytes
Address : 0x08000000
Erasing memory corresponding to segment 0:
Erasing internal memory sectors [0 1]
Download in Progress:
File download complete
Time elapsed during download operation: 00:00:02.196
Verifying ...
Download verified successfully
(Read)Failed determine breakpoint type
Error! Failed to read target status
Debugger connection lost.
Shutting down...
i don't know where is the problem
can you help me?
- Labels:
-
STM32CubeIDE
-
STM32F7 series
-
TouchGFX
- Mark as New
- Bookmark
- Subscribe
- Mute
- Subscribe to RSS Feed
- Permalink
- Email to a Friend
- Report Inappropriate Content
2020-02-26 3:08 AM
Do you have any breakpoints set in the QSPI flash memory at 0x90000000ish?
First try removing all breakpoint using the Breakpoints view.
Does that help?
If not, try to remove the debug configuration and create a new one with default settings. You may also disable the checkbox "set breakpint at main" and "Resume" on the startup tab of the debug config to see if you are able to step into the Reset_Handler without problems?!
Not working?
What if you try using OpenOCD instead instead of ST-LINK GDB server as the probe choice in the debug config?
- Mark as New
- Bookmark
- Subscribe
- Mute
- Subscribe to RSS Feed
- Permalink
- Email to a Friend
- Report Inappropriate Content
2020-02-27 7:32 AM
Hi, i clear all breakpoint, but don't fix it.
i use OpenCD and i have this message:
Open On-Chip Debugger 0.10.0+dev-01193-g5ce997d (2020-02-20-10:57)
Licensed under GNU GPL v2
For bug reports, read
http://openocd.org/doc/doxygen/bugs.html
srst_only separate srst_nogate srst_open_drain connect_assert_srst
Info : The selected transport took over low-level target control. The results might differ compared to plain JTAG/SWD
adapter speed: 8000 kHz
adapter_nsrst_delay: 100
Info : Listening on port 6666 for tcl connections
Info : Listening on port 4444 for telnet connections
Info : clock speed 8000 kHz
Info : STLINK V2J36S26 (API v2) VID:PID 0483:374B
Info : using stlink api v2
Info : Target voltage: 3.204180
Info : SRST line asserted
Warn : Silicon bug: single stepping will enter pending exception handler!
Info : STM32F746NGHx.cpu: hardware has 8 breakpoints, 4 watchpoints
Info : Listening on port 3333 for gdb connections
Info : accepting 'gdb' connection on tcp/3333
Info : SRST line released
target halted due to debug-request, current mode: Thread
xPSR: 0x01000000 pc: 0xb9337822 msp: 0x4c05b510
Info : Unable to match requested speed 8000 kHz, using 4000 kHz
Info : Unable to match requested speed 8000 kHz, using 4000 kHz
adapter speed: 4000 kHz
Info : device id = 0x10016449
Info : flash size = 1024kbytes
Info : SRST line asserted
Info : SRST line released
target halted due to debug-request, current mode: Thread
xPSR: 0x01000000 pc: 0xb9337822 msp: 0x4c05b510
Info : Unable to match requested speed 8000 kHz, using 4000 kHz
Info : Unable to match requested speed 8000 kHz, using 4000 kHz
adapter speed: 4000 kHz
target halted due to breakpoint, current mode: Thread
xPSR: 0x61000000 pc: 0x20000044 msp: 0x4c05b510
Info : SRST line asserted
Info : SRST line released
target halted due to debug-request, current mode: Thread
xPSR: 0x01000000 pc: 0xb9337822 msp: 0x4c05b510
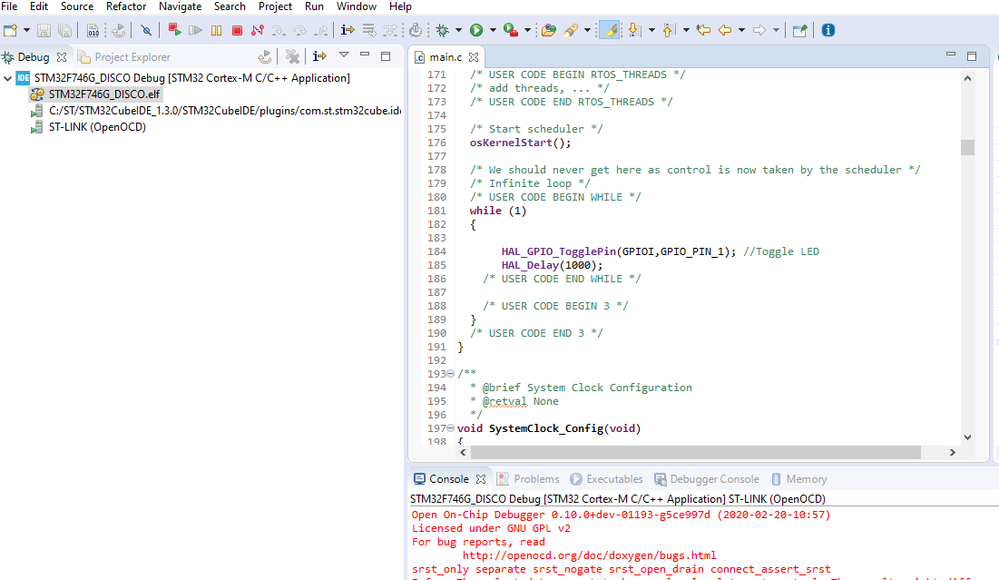
and this immage
you can see that i don't run the resume, if I comment the scheduler
// osKernelStart();
I always have the same problem, don't run the program
- Ardunio GIGA R1 - STM32H747I - cubeMX configuration- fail to power on in STM32 MCUs Boards and hardware tools
- How to Debug STM32N645 above 0x34200000 in STM32 MCUs Products
- Implementation of TouchGFX and LwIP in STM32F746G-DISCO Dev board in STM32 MCUs TouchGFX and GUI
- TouchGFX Button with Label Text position problem in STM32 MCUs TouchGFX and GUI
- Problem with Touchgfx "Program and Run Target" ->STM32N6570-DK in STM32 MCUs TouchGFX and GUI
