- STMicroelectronics Community
- STM32 MCUs
- STM32 MCUs TouchGFX and GUI
- Memory/Flash usage analysis
- Subscribe to RSS Feed
- Mark Topic as New
- Mark Topic as Read
- Float this Topic for Current User
- Bookmark
- Subscribe
- Mute
- Printer Friendly Page
Memory/Flash usage analysis
- Mark as New
- Bookmark
- Subscribe
- Mute
- Subscribe to RSS Feed
- Permalink
- Email to a Friend
- Report Inappropriate Content
2021-01-20 2:48 PM
Hello,
I am looking to perform a similar resource usage as explained here https://support.touchgfx.com/docs/basic-concepts/memory-usage/
However, I am wondering if there is a guide that is available using freely available tools to do
the memory analysis on the deployed code.
My environment is TouchGFX-Designer-4.16.0 and I am able to generate & deploy code to
an STM32F769I-DISCO board. I don't have dedicated IDEs installed yet.
I found C:/TouchGFXProjects/MyProjectName/gcc/Makefile
and I see the lines linker_options that eventually leads me to
TouchGFX\build\bin\application.map - Is this the correct file?
Its contents is not summarized as shown in the examples, so I am wondering if
there are post processing steps that can be done to that file.
Or is there a better option?
Is the expectation to be able to just open the .cproject file in STM32CubeIDE and do a build?
An updated guide on the analysis based on STM32CubeIDE or VisualStudioCode maybe more accessible for more people that are just getting started.
Thanks for everyone's time!
Solved! Go to Solution.
- Labels:
-
STM32F7 series
-
TouchGFX
Accepted Solutions
- Mark as New
- Bookmark
- Subscribe
- Mute
- Subscribe to RSS Feed
- Permalink
- Email to a Friend
- Report Inappropriate Content
2021-01-21 6:43 AM
Hi,
This is indeed the map file generated when building from the Designer, using a Makefile-gcc toolchain, unfortunately ST does no provide some easy ways to analyze this file which can be quite huge.
However if you install STM32CubeIDE and open the .cproject you will be able to build, flash and debug your application without further effort as it is the default IDE.
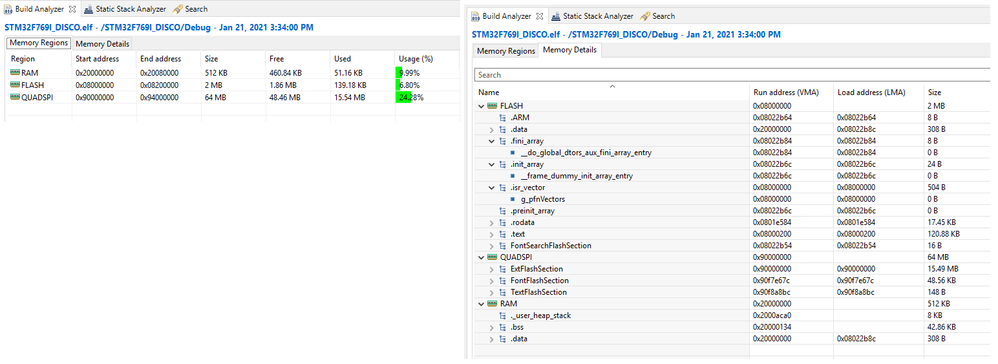
Moreover STM32CubeIDE provides some high level memory usage view, once your project is built through the "Build Analyzer" window, and in the same window but in the "Memory Details" tab you get a deeper view, region per region (as defined in the .ld scatter file) :

I hope this will help,
Best regards,
Nicolas
- Mark as New
- Bookmark
- Subscribe
- Mute
- Subscribe to RSS Feed
- Permalink
- Email to a Friend
- Report Inappropriate Content
2021-01-21 6:43 AM
Hi,
This is indeed the map file generated when building from the Designer, using a Makefile-gcc toolchain, unfortunately ST does no provide some easy ways to analyze this file which can be quite huge.
However if you install STM32CubeIDE and open the .cproject you will be able to build, flash and debug your application without further effort as it is the default IDE.
Moreover STM32CubeIDE provides some high level memory usage view, once your project is built through the "Build Analyzer" window, and in the same window but in the "Memory Details" tab you get a deeper view, region per region (as defined in the .ld scatter file) :

I hope this will help,
Best regards,
Nicolas
- Mark as New
- Bookmark
- Subscribe
- Mute
- Subscribe to RSS Feed
- Permalink
- Email to a Friend
- Report Inappropriate Content
2021-01-21 7:02 AM
Back in ye-olde days, when programmers could program, and women could do math that put men on the moon and bring them safely back again we'd just write a script to process the .MAP and generate the statistics we were interested in...
Up vote any posts that you find helpful, it shows what's working..
- Import ioc-file into existing project - workflow in CubeIDE 2.x not totally clear in STM32CubeIDE (MCUs)
- STM32CubeMonitor-Power: Add Logarithmic Scaling ? in STM32CubeMonitor (MCUs)
- BLE fails on cold boot, but works perfectly after entering FUS mode. in STM32 MCUs Wireless
- STM32CubeMonitor-UCPD altanative trace application w/STM32G071B-DISCO in STM32CubeMonitor (MCUs)
- Modularize STM32CubeIDE for VSCode: Split debugging support VSCode extensions from Core + Build in STM32CubeIDE for Visual Studio Code (MCUs)