- STMicroelectronics Community
- STM32 MCUs
- STM32 MCUs TouchGFX and GUI
- Re: How to make X-axis of DynamicGraph widget for ...
- Subscribe to RSS Feed
- Mark Topic as New
- Mark Topic as Read
- Float this Topic for Current User
- Bookmark
- Subscribe
- Mute
- Printer Friendly Page
How to make X-axis of DynamicGraph widget for real time measurement
- Mark as New
- Bookmark
- Subscribe
- Mute
- Subscribe to RSS Feed
- Permalink
- Email to a Friend
- Report Inappropriate Content
2021-04-06 8:38 PM
Hi Folks,
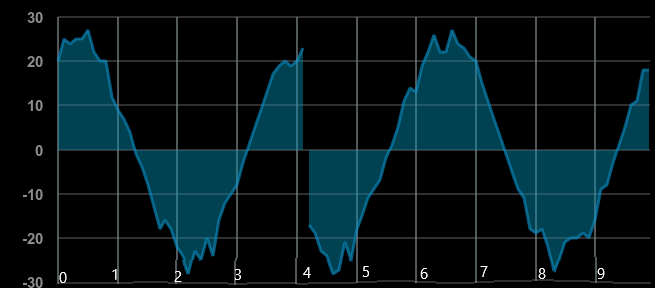
I am developing a prototype for real time measurement of particular analog value. The intention is to show graph showing real time measurement, it take data every 0.1s but the X-axis would show label 0 - 9 s (fixed) This mean, every 1s contains 10 data points, total 100 points.
But when I tried Touchgfx designer DynamicGraph widget, it shows 2 problems:
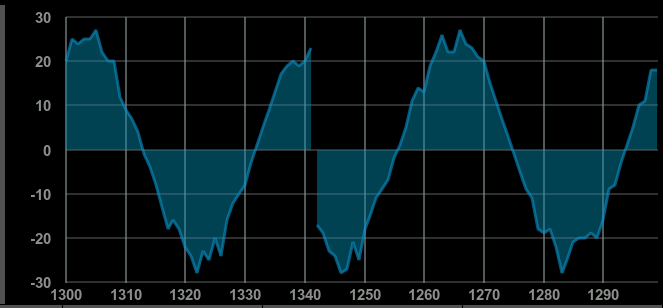
- The X-axis label is by data point count, so in this case, it show 0 - 99 data point instead of 0 -9s.
- The X-axis label grows as data point increased while what I want is fixed.
What I want is like this; X-axis label is fixed 0 - 9s ( I draw manually the X-axis by hand, not generated by touchgfx)

But what Touchgfx gives me is this:

Setting:

STM32F769 Dicovery Kit.
Could someone give me some pointers/direction please?
Solved! Go to Solution.
- Labels:
-
TouchGFX
Accepted Solutions
- Mark as New
- Bookmark
- Subscribe
- Mute
- Subscribe to RSS Feed
- Permalink
- Email to a Friend
- Report Inappropriate Content
2021-04-07 6:34 AM
Problem 1: keeping the x-axis fixed. See my thread on how to reset the X-axis. Call this every 10 seconds / 100 points / whenever the graph rolls over.
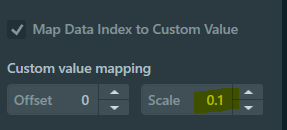
Problem 2: mapping the x-axis values to something that isn't the datapoint index. You're looking for the x-axis scale. Change it to 0.1 - that way for each datapoint you add, the x-axis number it maps to increases by 0.1. Edit: increase the level of precision above 1 so that the graph can properly represent your data.
- Mark as New
- Bookmark
- Subscribe
- Mute
- Subscribe to RSS Feed
- Permalink
- Email to a Friend
- Report Inappropriate Content
2021-04-06 10:56 PM
If I have correctly understood your problem, I think you have to modify your ScreenXXX.cpp and insert :
dynamicGraphXXX.setGraphRangeX(min+range, max+range);

range=range+9;
I never used this function, but I think it is the right one (.. I hope) ;)
- Mark as New
- Bookmark
- Subscribe
- Mute
- Subscribe to RSS Feed
- Permalink
- Email to a Friend
- Report Inappropriate Content
2021-04-06 11:49 PM
Thank you @MM.22aino , however that does not really the intention here. Function setGraphRangeX() is to zoom out part f the graph, but here I still want to display the entire graph (100 points) but with x-axis label fixed 0-9s. So the Y major grid will be in step of 10 points, but instead of showing 0, 10, 20, ...90, I want it to show 0,1,2 ...9. Basically I want my graph to tell user that the X-axis showing data in the span of 10s
- Mark as New
- Bookmark
- Subscribe
- Mute
- Subscribe to RSS Feed
- Permalink
- Email to a Friend
- Report Inappropriate Content
2021-04-07 6:34 AM
Problem 1: keeping the x-axis fixed. See my thread on how to reset the X-axis. Call this every 10 seconds / 100 points / whenever the graph rolls over.
Problem 2: mapping the x-axis values to something that isn't the datapoint index. You're looking for the x-axis scale. Change it to 0.1 - that way for each datapoint you add, the x-axis number it maps to increases by 0.1. Edit: increase the level of precision above 1 so that the graph can properly represent your data.
- Mark as New
- Bookmark
- Subscribe
- Mute
- Subscribe to RSS Feed
- Permalink
- Email to a Friend
- Report Inappropriate Content
2021-04-08 2:48 AM
Thanks @Michael K ,
But for problem 2, I set the Scale to 0.1, it ends up X-label show all 0s.

Result:
- Mark as New
- Bookmark
- Subscribe
- Mute
- Subscribe to RSS Feed
- Permalink
- Email to a Friend
- Report Inappropriate Content
2021-04-08 10:55 AM
Two things to try. Select the graph widget in TouchGFX designer and:
- Increase the Level of Precision (under Data Points)
Increase the number of Decimal Points (under X-Axis Labels -> Major Labels)
Edit: just tried it, to fix the zeros you only need to increase the level of precision. Then you can add as many or as few decimals as you want to the x-axis labels.
- Mark as New
- Bookmark
- Subscribe
- Mute
- Subscribe to RSS Feed
- Permalink
- Email to a Friend
- Report Inappropriate Content
2021-04-08 5:34 PM
Thank you so much @Michael K , it works great :)
- Mark as New
- Bookmark
- Subscribe
- Mute
- Subscribe to RSS Feed
- Permalink
- Email to a Friend
- Report Inappropriate Content
2021-04-09 6:52 AM
You're welcome! Glad to help.
