- STMicroelectronics Community
- STM32 MCUs
- STM32 MCUs Embedded software
- STM32 Cube IDE: Reset_Handler() at 0x80021e0
- Subscribe to RSS Feed
- Mark Topic as New
- Mark Topic as Read
- Float this Topic for Current User
- Bookmark
- Subscribe
- Mute
- Printer Friendly Page
STM32 Cube IDE: Reset_Handler() at 0x80021e0
- Mark as New
- Bookmark
- Subscribe
- Mute
- Subscribe to RSS Feed
- Permalink
- Email to a Friend
- Report Inappropriate Content
2023-11-30 12:20 PM
Hi STM team,
I am using the STM32WL55CCU6 MCU on a custom PCB project. I actually have two of these. One is working as a master, while the other operates as a slave. My slave device is working properly, but the master is not.
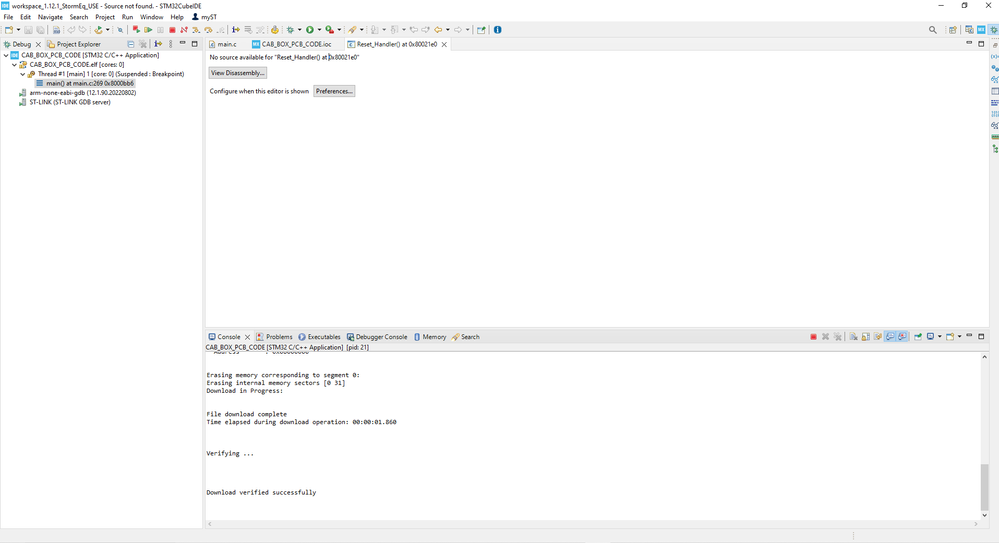
Problem Statement: When debugging, a tab appears with the information: "Reset_Handler() at 0x80021e0". Attached is a screenshot. I am not sure what is causing this, but I think it is blocking my code from executing properly because when I place breakpoints at the printf() and APP_LOG() debugging statements, these do not execute, and no output is shown on the terminal.
Note: under Properties > C/C++ Build > Settings MCU GCC Assembler > Debugging I have set to maximum (-g3). Under MCU GCC Compiler > Optimization I have set to None (-O0).
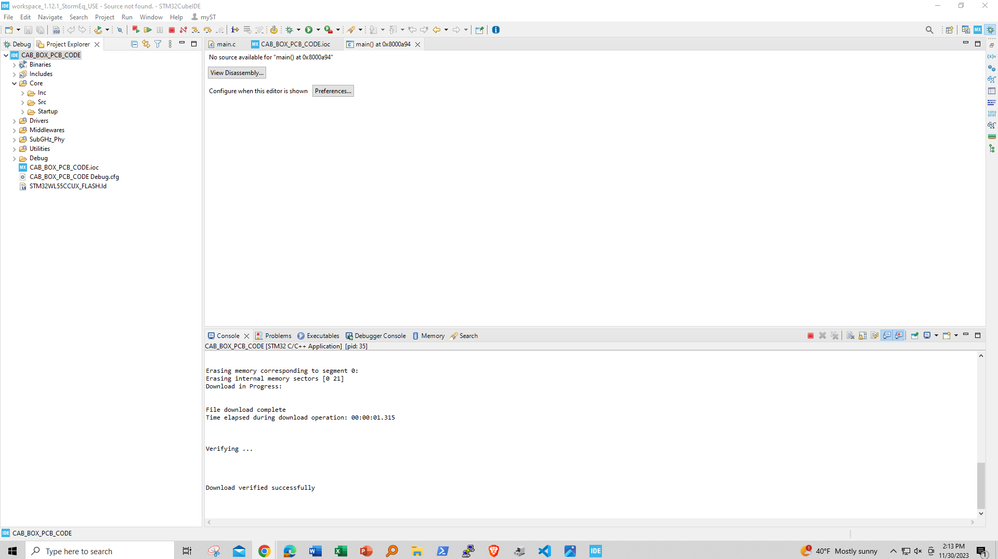
When I change these configurations to default (-g) and optimize for Debug (-Og) respectively, the warning tab that appears changes to: "main() at 0x8000a94". Attached is a 2nd screenshot depicting this.
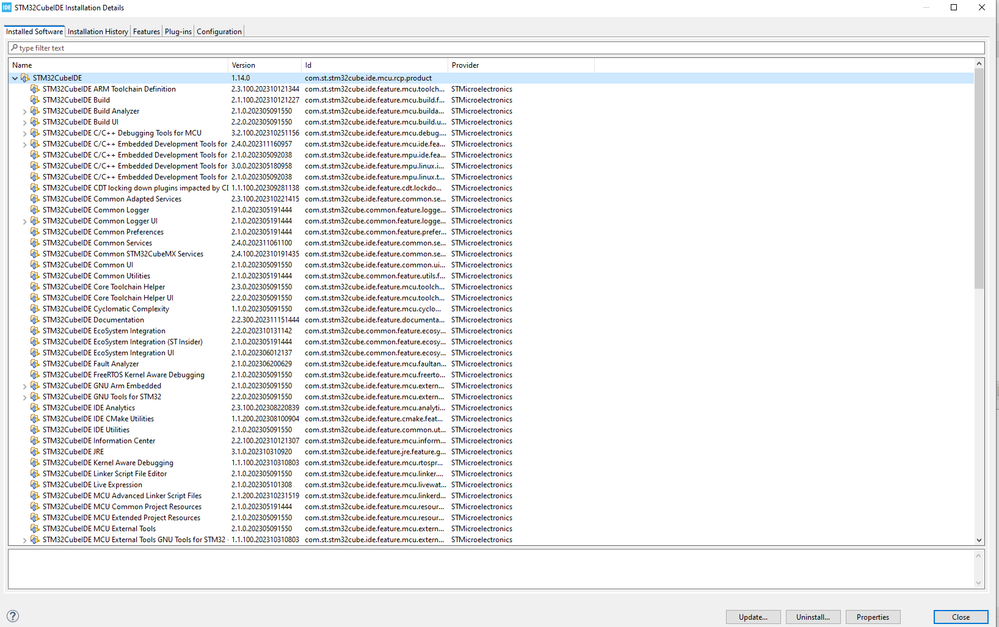
I am using STMCubeIDE Version 1.14.0 I have included a 3rd photo showing the software versions I am using. I have double checked my pin configurations, clock settings and there are no errors or warnings that show up after building. I have looked at the online forums and I can't find anything helpful. Is there anyone that can help me troubleshoot this issue? It is time sensitive, and I am a software developer for a company. We are customers of ST. If there is another way to get in contact with an ST FAE, I would appreciate that information as well.
Please let me know if there is any other relevant information I can provide.
Thank you for any support in advance,
-Jake
- Labels:
-
STM32Cube MCU packages
- Mark as New
- Bookmark
- Subscribe
- Mute
- Subscribe to RSS Feed
- Permalink
- Email to a Friend
- Report Inappropriate Content
2023-12-03 6:04 AM
If code can't be found, it's possible your debugging configuration doesn't have debugging enabled. You can enable this in project settings (C/C++ Build -> Settings).
If the IDE can't make the link between source code and what's running, none of your breakpoints will work.
- Mark as New
- Bookmark
- Subscribe
- Mute
- Subscribe to RSS Feed
- Permalink
- Email to a Friend
- Report Inappropriate Content
2023-12-03 2:55 PM
Hi, on your 1st screenshot the debugger is stopped at the breakpoint on main(). This is normal. Double click on the main() item in the stack trace pane on the left, the editor should activate main.c and position somewhere in the main() function. If this happens, all is good.
On your 2nd screenshot, the stack trace pane is not shown. This is unusual. Can you manually bring up the stack trace view? If you open disassembly, does it look sane?
- STM32CUBE IDE 2.0.0 build failure and moving Inc and Src to Project root folder. in STM32CubeIDE (MCUs)
- Fail to build SBSFU example in STM32 MCUs Security
- STM32U375 external loader issue with global variable initialization in STM32CubeProgrammer (MCUs)
- unknown in flash after linked-script-user-defined const in STM32 MCUs Embedded software
- STM32L433 Precise BusFault on GPIO access (BFAR = 0x48000000) despite enabling GPIO clock in STM32 MCUs Products


