Turn on suggestions
Auto-suggest helps you quickly narrow down your search results by suggesting possible matches as you type.
Showing results for
- STMicroelectronics Community
- MEMS and sensors
- Imaging (sensors)
- VL53L4CX Histogram Data Interpreting
Options
- Subscribe to RSS Feed
- Mark Topic as New
- Mark Topic as Read
- Float this Topic for Current User
- Bookmark
- Subscribe
- Mute
- Printer Friendly Page
VL53L4CX Histogram Data Interpreting
Options
- Mark as New
- Bookmark
- Subscribe
- Mute
- Subscribe to RSS Feed
- Permalink
- Email to a Friend
- Report Inappropriate Content
2025-03-10 10:02 AM
Hi! I've been testing the VL53L4CX sensor for the past few months and have finally decided to take a look at its additional histogram data. My most recent test is a measurement of an empty black bucket with a white sheet inside (to increase reflectivity). While the distance measured is accurate, the histogram data, which I expected to be somewhat static, seems to oscillate between two histogram shapes.
The data below is distance, minimum distance and max distance measured.
244,244,246, 2025-03-10 11:48:04.530766
241,241,330, 2025-03-10 11:48:04.727428
243,243,245, 2025-03-10 11:48:04.926467
241,241,330, 2025-03-10 11:48:05.124474
243,243,245, 2025-03-10 11:48:05.322733
241,241,330, 2025-03-10 11:48:05.519547
243,243,331, 2025-03-10 11:48:05.711350
Below are the histograms (AdditionalData.VL53LX_p_006.bin_data) for each measurement.
847,860,895,867,757,815,139036,190843,89753,1021,794,804,848,803,827,828,790,853,892,731,833,759,843,803, 2025-03-10 11:48:04.530766
704,729,118073,161246,72683,950,692,668,696,728,727,765,671,715,716,707,730,684,700,686,729,694,690,660, 2025-03-10 11:48:04.727428
864,847,892,835,749,819,139085,191128,89488,1020,806,804,870,810,804,836,814,843,879,773,831,755,823,814, 2025-03-10 11:48:04.926467
709,727,118154,161163,72882,939,696,659,682,756,716,773,696,712,724,711,713,659,709,701,748,706,670,678, 2025-03-10 11:48:05.124474
852,857,905,856,758,818,139120,191652,89457,1034,823,812,858,835,834,885,830,843,886,790,842,744,819,843, 2025-03-10 11:48:05.322733
719,729,118138,161018,72904,936,711,658,664,761,704,743,690,693,715,700,681,676,691,696,760,709,667,683, 2025-03-10 11:48:05.519547
847,839,877,834,763,801,139485,191888,89571,1056,833,811,845,821,820,913,863,820,893,802,847,739,805,850, 2025-03-10 11:48:05.711350
These are the same histogram data, but normalized for easier reading:
0.002 0.002 0.002 0.002 0.002 0.002 0.318 0.437 0.205 0.002 0.002 0.002 0.002 0.002 0.002 0.002 0.002 0.002 0.002 0.002 0.002 0.002 0.002 0.002
0.002 0.002 0.322 0.439 0.198 0.003 0.002 0.002 0.002 0.002 0.002 0.002 0.002 0.002 0.002 0.002 0.002 0.002 0.002 0.002 0.002 0.002 0.002 0.002
0.002 0.002 0.002 0.002 0.002 0.002 0.318 0.437 0.205 0.002 0.002 0.002 0.002 0.002 0.002 0.002 0.002 0.002 0.002 0.002 0.002 0.002 0.002 0.002
0.002 0.002 0.322 0.439 0.198 0.003 0.002 0.002 0.002 0.002 0.002 0.002 0.002 0.002 0.002 0.002 0.002 0.002 0.002 0.002 0.002 0.002 0.002 0.002
0.002 0.002 0.002 0.002 0.002 0.002 0.318 0.438 0.204 0.002 0.002 0.002 0.002 0.002 0.002 0.002 0.002 0.002 0.002 0.002 0.002 0.002 0.002 0.002
0.002 0.002 0.322 0.439 0.199 0.003 0.002 0.002 0.002 0.002 0.002 0.002 0.002 0.002 0.002 0.002 0.002 0.002 0.002 0.002 0.002 0.002 0.002 0.002
0.002 0.002 0.002 0.002 0.002 0.002 0.318 0.437 0.204 0.002 0.002 0.002 0.002 0.002 0.002 0.002 0.002 0.002 0.002 0.002 0.002 0.002 0.002 0.002
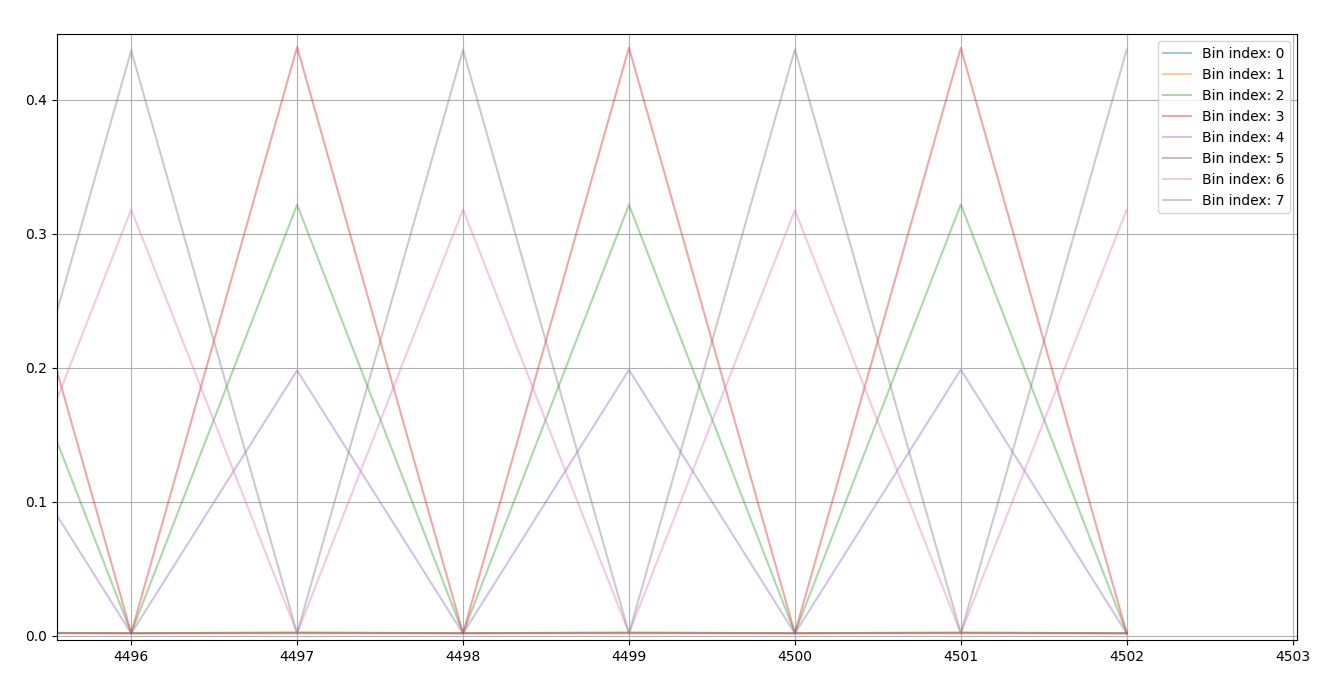
I'm also indexing a line graph with a zoom on the bins 0 up to 7, normalized and non normalized, as I know reading this histogram data as text can be unbearable.
I've had this behaviour consistent for the whole duration of the test (15 minutes), and I've also observed that the max distance measurement (which is also changing frequently between measurements) has no relation to the histogram data. My understanding is that this histogram should be static as the photons detected are binned according to ToF (which correlates directly to distance).
Am I misinterpreting the data or missing something on the additional data struct? I've not found documentation on the additional data struct nor any other forum posts about this same topic, so I believe this is all expected behaviour and I'm lacking knowlege on the topic. I'm interested in understanding it in the hopes that it helps me solve some other issues I've been solving on this sensor.
I'm using long distance mode, max timing budget (200 ms), no coverglass and no calibrations.
Thanks in advance,
Leonardo
Labels:
- Labels:
-
Time of flight
1 REPLY 1
Options
- Mark as New
- Bookmark
- Subscribe
- Mute
- Subscribe to RSS Feed
- Permalink
- Email to a Friend
- Report Inappropriate Content
2025-03-10 11:40 AM
you are a victim of poor documentation, I think. The chip designers never thought anyone would care and so they did not put much effort into this.
If you plot the first 2 lines of your normalized data you get:

But if you understood that the first 4 bins of the 'A' ranges are ambient light values you could remove those, and your 'A' ranges will line up with your 'B' ranges.
In your data it's an exact match:

There are 4 ambient bits and 20 range bins in the 'A' ranges and 24 range bins in the 'B' ranges.
Each bin represents 20cm of range (20 bins =4M). The 'B' range has 24 bins. Looking at both allows one to look for radar aliasing (or wrap-around). When one puts a target at 4.1M, the photons from one blast will return after the photons of the next blast come out, giving an answer of 0.1M (4.1- the wrap point of 4M). But with the B range having a different number than the A range, you can detect this wrap and flag a warning.
If this or any post solves your issue, please mark them as 'Accept as Solution' It really helps. And if you notice anything wrong do not hesitate to 'Report Inappropriate Content'. Someone will review it.