- STMicroelectronics Community
- STM32 MCUs
- STM32 MCUs Products
- ETM trace with Ulink pro in STM32CUBEMX
- Subscribe to RSS Feed
- Mark Topic as New
- Mark Topic as Read
- Float this Topic for Current User
- Bookmark
- Subscribe
- Mute
- Printer Friendly Page
ETM trace with Ulink pro in STM32CUBEMX
- Mark as New
- Bookmark
- Subscribe
- Mute
- Subscribe to RSS Feed
- Permalink
- Email to a Friend
- Report Inappropriate Content
2018-03-03 7:10 AM
I am using STM3210C EVAL board (stm32f107vc). UlinkPro debugger.
Here is the tutorial I found from keil.com.
http://www.keil.com/support/man/docs/ulinkpro/ulinkpro_stm32f10xxx_etm.htm
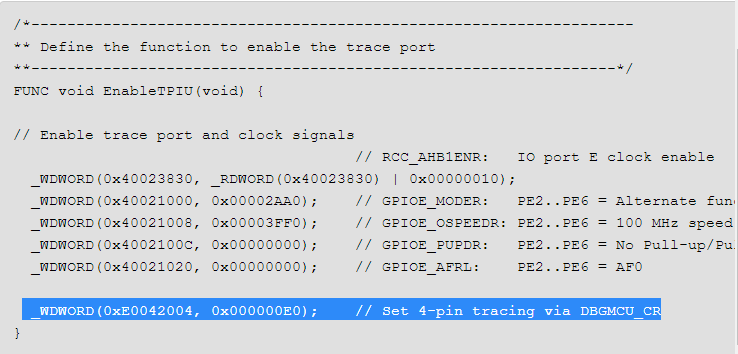
Here is the snipping.

So, when we need to using ETM trace, we just need to enable the Trace PORTs clock, and configure them as AFIO with highest speed, then set the DBGMCU_CR, that's it?
What I found in the STM32F107 user manual is this!
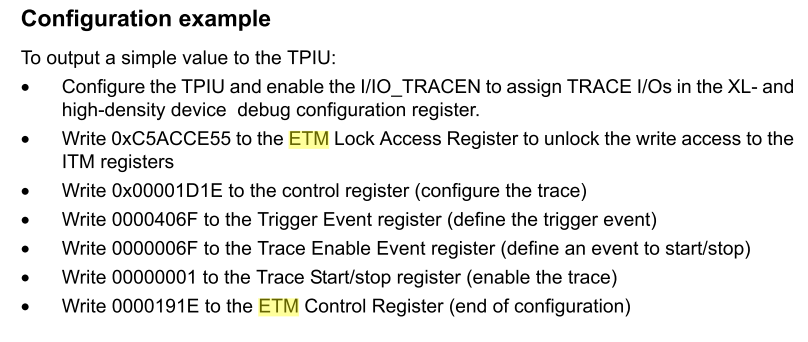
it looks different!
As I config in the CUBEMX with trace sw (4 bits), the output code doesn't do any thing related to the trace PORTs.
If I don't use trace.ini (as KEIL says) to pre-configure the MCU, ETM also works!
What rules should I follow when ETM tracing STM32 MCU?
Boys.Bob
‌ Please pay your attention? thanks ^ ^#etm- Labels:
-
Debug
- Mark as New
- Bookmark
- Subscribe
- Mute
- Subscribe to RSS Feed
- Permalink
- Email to a Friend
- Report Inappropriate Content
2018-03-03 11:39 AM
Hello
I did not write the instructions on keil.com - but they look accurate.
1) The code you display for the .ini file is to set the Trace Port GPIO pins to handle ETM the best.
2) The code you show from the ST manual is something different - this configures ETM inside the CoreSight module in the STM32.
3) uVision sets this ''under the hood'' when you enter Debug mode. You do not need to set these manually.
Why does the ETM trace work even without the .ini file ? There are several possibilities: the major one that these are set somewhere else.
1) Is CubeMX configuring these in your code somewhere ?
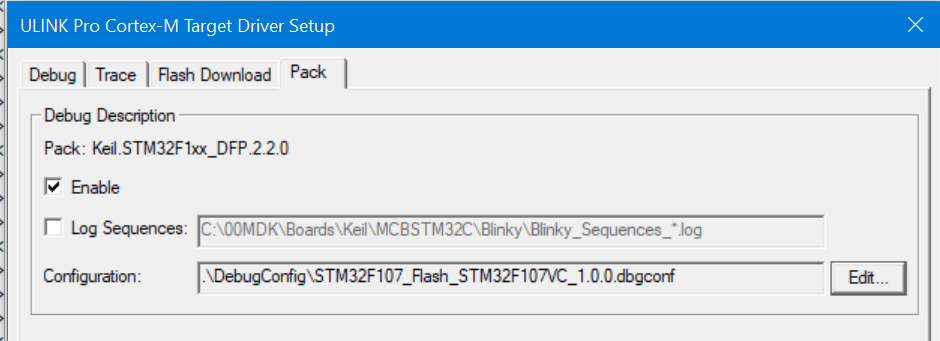
2) In the latest Software Pack - there is a new entry - in the Target Driver Setup window there is sometimes a new tab: Pack. See below. This can contain a file dbgconf as shown below. This is used instead of the .ini file in the older way.
3) It doesn't need to have the GPIO pins configured ? This might mean ETM won't work reliably at the highest speeds. It all depends on what needs to be turned on or off - some parts need a Alternative Pin to be switched to ETM.
You can check these by examining the GPIOE registers to see what is set in there.
Note: in the .ini file - if you RESET the processor with uVision - you would lose the effect of this ini file. Adding this code will rerun the ini file after a RESET without exiting and re-entering Debug mode:
// Executed after reset via uVision's 'Reset'-button
FUNC void OnResetExec (void) { SetupTrace();}What's New: With MDK 5.25, you can now display Exceptions in graphical format in Event Viewer and System Viewer even if you are not using an RTOS. Code Coverage and Performance Analysis still works and Trace Triggers were added a while ago.
Hope this explains what is going on in your system.
Thanlks
Bob Boys
- Mark as New
- Bookmark
- Subscribe
- Mute
- Subscribe to RSS Feed
- Permalink
- Email to a Friend
- Report Inappropriate Content
2018-03-03 8:11 PM
In the pack. I found this.
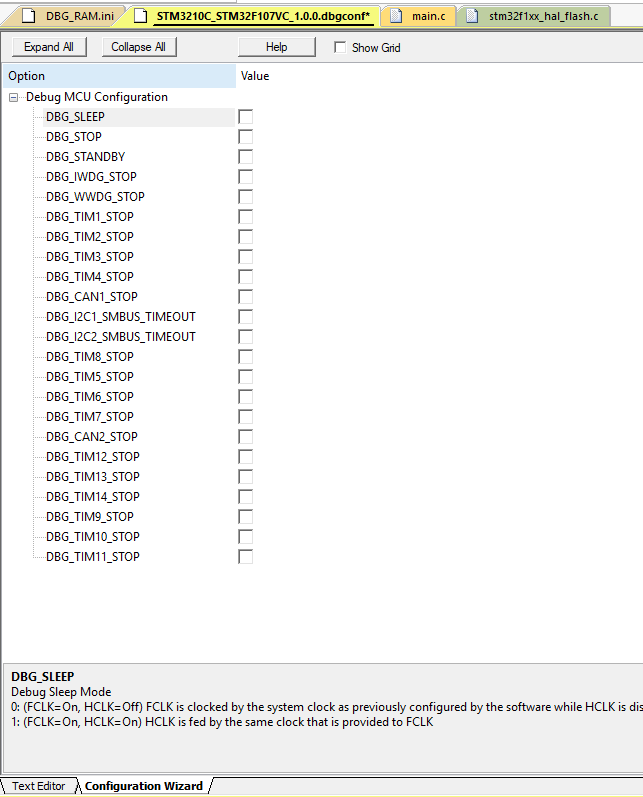
In my case, I will leave all unchecked.
Then I look in the Text Editor.
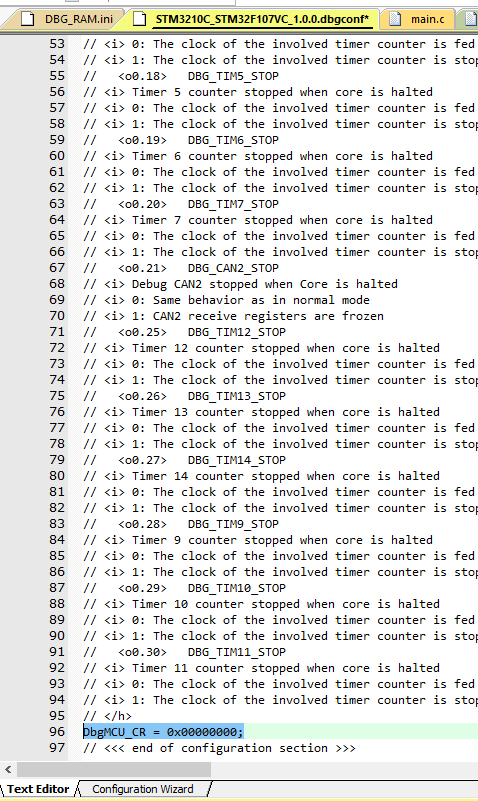
DbgMCU_CR = 0x00000000; !!!
What is the pack doing?!!!
Maybe I can see the register
who will run first
.But this really get people confusing.
if
*
.dbgconf first, the finallyDbgMCU_CR will be rewrite to 0x000000E0. That is ok.
But if my *.ini file (Project - options - debug ) run first, DbgMCU_CR = 0;
there are 2 ways for us to configure the ETM tracing ?
1. add *.ini file in the Project - options - debug and write the code by myself, disable the pack?
2. Just use *.
dbgconf
only, but I still have to add some code in the file ? ( the pack debug initialization file just imperfect now, It may be updated later?)- Mark as New
- Bookmark
- Subscribe
- Mute
- Subscribe to RSS Feed
- Permalink
- Email to a Friend
- Report Inappropriate Content
2018-03-04 12:18 AM
Hello
It looks like the pack file doesn't have ETM enabled. This could be an early version and someone expected an .ini file to be also used. I will point this out and get it fixed.
There are three ways to enable ETM that I know of::
1) a .ini file. This was the first way we did this - before packs were available. We did not take this away when the newer method came to preserve some compatibility. We now can use this to configure the new ULINKplus and other things.
2) the dbgconf file located in the Pack. This can be disabled.
3) Since CoreSight information is public - you can enable it in your source code as you saw in the ST document.
I suppose you can set a Watchpoint to the address of
DbgMCU_CR
and the user program will stop when this is written to exposing the instruction doing this - or at least very close.It sounds like you have ETM working quite well.
Thanks !
Bob
- Mark as New
- Bookmark
- Subscribe
- Mute
- Subscribe to RSS Feed
- Permalink
- Email to a Friend
- Report Inappropriate Content
2018-03-04 3:54 AM
Posted on March 04, 2018 at 11:54
HI, Bob.
After I did some experiment on my STM3210C EVAL Plus ULink Pro.
Finally I know how to use the pack.
This is the snipping From the pack log file.

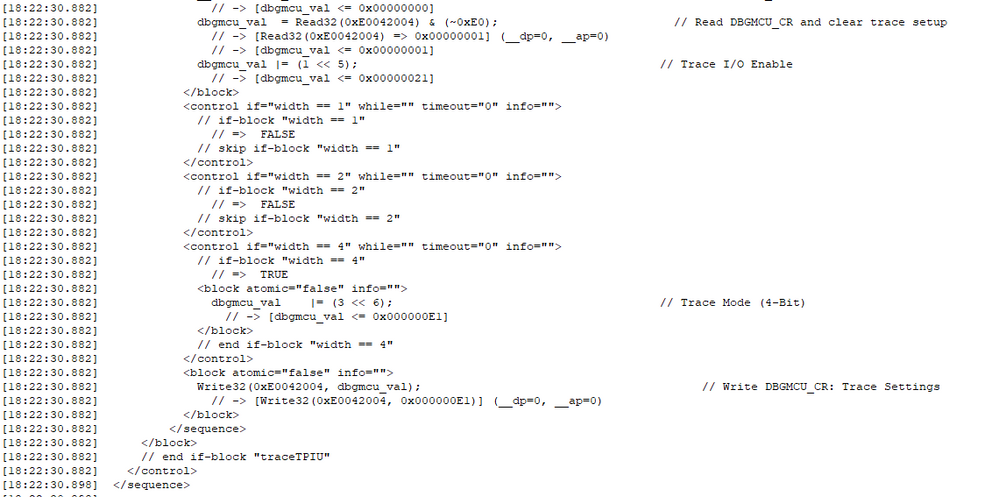
The pack did have ETM enabled.
I don't need to follow this method
http://www.keil.com/support/man/docs/ulinkpro/ulinkpro_stm32f10xxx_etm.htm
if Ihave the pack to choose from, pack is enough,
all I need to do is just enable the pack, easy! great!
if I config the
DbgMCU_CR by myself in the *.ini file, It did makes conflict with pack.
After I look moreabout the debug setting inCUBEMX and the code it generates, please refer to my this thread.
https://community.st.com/s/question/0D50X00009XkXxi/stm32-cubemx-sys-debug-settings
Finally I think I know how to work with CUBEMX and KEIL together to set upETM trace the best and easy way!
KEIL will pre-configure the DBG register though PPB bus.
CUBEMX will initialize the pripherals clock (GPIOA, GPIOE, AFIO), that's all!
I don't need to configure the Debug access Ports any more in the *ini file. Because CUBEMX takes that job.
I think tracing will work fine after executing the CUBEMX initialization related to Trace (
initialize the pripherals clock (GPIOA, GPIOE, AFIO) but they don't config the GPIO speed to be highest)
.
and I right?
Anyway, I love UlinkPro! thans for your appnotes, then I decide to buy one!
I will dig in more the power it has. But I should make the configuration correctly ^ ^
Or I just can't work with CUBEMX debug setting with keil together.
Just follow what KEIL tells me to do. That's enough.
And I think ST team should add more information aboutDebug setting in the CUBEMX manual.
st.mcu
- STM32H5 JTDO/TRACESWO pin not working as UART7_RX despite alternate function support in STM32 MCUs Products
- EPR request in STM32G071 in STM32 MCUs Embedded software
- Bug Report: STM32CubeMX Incorrectly Maps SWO Function to PB3 not PB5 for STM32N6 in STM32CubeMX (MCUs)
- system_stm32wb0x.c - dangerous relocation: unsupported relocation in STM32CubeMX (MCUs)
- CubeMX 6.16.0: Headless installation in Docker (Ubuntu 24.04) fails in STM32CubeMX (MCUs)