- STMicroelectronics Community
- STM32 MCUs Software development tools
- STM32CubeIDE (MCUs)
- Re: STM32CubeIDE Cannot run program "gdb": Launchi...
- Subscribe to RSS Feed
- Mark Topic as New
- Mark Topic as Read
- Float this Topic for Current User
- Bookmark
- Subscribe
- Mute
- Printer Friendly Page
STM32CubeIDE Cannot run program "gdb": Launching failed
- Mark as New
- Bookmark
- Subscribe
- Mute
- Subscribe to RSS Feed
- Permalink
- Email to a Friend
- Report Inappropriate Content
2019-05-01 08:34 AM
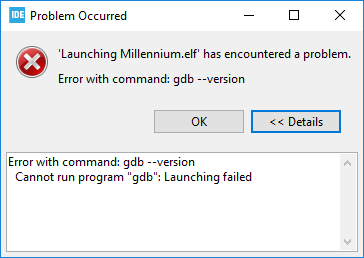
I'm sure it's something silly and I can't believe I'm the only person who has seen this message but searching this site doesn't yield any clues. Can someone point me to what I am setting up wrong, presumably in the Debug Configuration menu ?
- Labels:
-
STM32CubeIDE
- Mark as New
- Bookmark
- Subscribe
- Mute
- Subscribe to RSS Feed
- Permalink
- Email to a Friend
- Report Inappropriate Content
2019-05-06 05:30 AM
Could be quite a few things. Could you activate the gdb server log in the "Debugger" tab there's a "Log to file:" that you can click and then paste here.
- Mark as New
- Bookmark
- Subscribe
- Mute
- Subscribe to RSS Feed
- Permalink
- Email to a Friend
- Report Inappropriate Content
2019-11-05 12:30 PM

Where exactly is the option to log to a file? I can't find what you mean.
I did find this error log about the problem:
!ENTRY org.eclipse.cdt.dsf.gdb 4 5012 2019-11-05 16:04:49.906
!MESSAGE Error with command: gdb --version
!STACK 0
java.io.IOException: Cannot run program "gdb": Launching failed
at org.eclipse.cdt.utils.spawner.Spawner.exec(Spawner.java:352)
at org.eclipse.cdt.utils.spawner.Spawner.<init>(Spawner.java:94)
at org.eclipse.cdt.utils.spawner.Spawner.<init>(Spawner.java:124)
at org.eclipse.cdt.utils.spawner.ProcessFactory.exec(ProcessFactory.java:73)
at org.eclipse.cdt.dsf.gdb.launching.LaunchUtils.getGDBVersion(LaunchUtils.java:320)
at org.eclipse.cdt.dsf.gdb.launching.GdbLaunch.getGDBVersion(GdbLaunch.java:511)
at org.eclipse.cdt.dsf.gdb.launching.GdbLaunchDelegate.launchDebugSession(GdbLaunchDelegate.java:147)
at org.eclipse.cdt.dsf.gdb.launching.GdbLaunchDelegate.launchDebugger(GdbLaunchDelegate.java:106)
at org.eclipse.cdt.dsf.gdb.launching.GdbLaunchDelegate.launch(GdbLaunchDelegate.java:94)
at org.eclipse.debug.internal.core.LaunchConfiguration.launch(LaunchConfiguration.java:860)
at org.eclipse.debug.internal.core.LaunchConfiguration.launch(LaunchConfiguration.java:719)
at org.eclipse.debug.internal.ui.DebugUIPlugin.buildAndLaunch(DebugUIPlugin.java:1017)
at org.eclipse.debug.internal.ui.DebugUIPlugin$2.run(DebugUIPlugin.java:1220)
at org.eclipse.core.internal.jobs.Worker.run(Worker.java:63)
Thanks
- Mark as New
- Bookmark
- Subscribe
- Mute
- Subscribe to RSS Feed
- Permalink
- Email to a Friend
- Report Inappropriate Content
2019-11-05 03:50 PM
I get errors like that when the debugger isn't connected and i try to start it. Usually saying 'Doh!' and plugging the debugger into the target board and turning it on fixes everything.
- Mark as New
- Bookmark
- Subscribe
- Mute
- Subscribe to RSS Feed
- Permalink
- Email to a Friend
- Report Inappropriate Content
2019-11-11 10:53 AM
That's definitely not my problem. It has something to do with the new installation of the IDE. My old Atollic version still works just fine.
- Mark as New
- Bookmark
- Subscribe
- Mute
- Subscribe to RSS Feed
- Permalink
- Email to a Friend
- Report Inappropriate Content
2019-11-11 11:32 AM
As the original creator of this thread, and just for the record, after six months I still haven't solved this problem. Compilation works but debugging in CubeIDE just doesn't ... at least on my system.
- Mark as New
- Bookmark
- Subscribe
- Mute
- Subscribe to RSS Feed
- Permalink
- Email to a Friend
- Report Inappropriate Content
2019-11-11 01:01 PM
Looks like you don't have it pointed to the correct exe. In the "Debugger" tab give full path of the gdb.exe(Windows machine) of the cross compiler that you might have installed as the "GDB command".
For me it is "C:\Program Files (x86)\GNU Tools Arm Embedded\7 2018-q2-update\bin\arm-none-eabi-gdb.exe"
- Mark as New
- Bookmark
- Subscribe
- Mute
- Subscribe to RSS Feed
- Permalink
- Email to a Friend
- Report Inappropriate Content
2019-11-11 01:38 PM
You are correct, but I think the underlying issue is that Atollic installed gdb.exe and STM32CubeIDE does not. At least not for me. I have searched the install path and I can't find it. I assumed it would install everything that was needed just like Atollic did.
- Mark as New
- Bookmark
- Subscribe
- Mute
- Subscribe to RSS Feed
- Permalink
- Email to a Friend
- Report Inappropriate Content
2019-11-12 07:51 AM
I think @Community member 's problem is solved, can you check if you are also facing the same issue?
- Mark as New
- Bookmark
- Subscribe
- Mute
- Subscribe to RSS Feed
- Permalink
- Email to a Friend
- Report Inappropriate Content
2019-11-12 08:28 AM
Actually it did not fix my problem. I pointed to gdb.exe from a previous installation and it gave me different errors. The gdb.exe is supposed to be installed with the IDE and for some reason on my machine it is not getting installed.
- The STM32CubeIDE download link is wrong (Windows) in STM32CubeIDE (MCUs)
- How to set Rank of A/D inputs for a L031 chip using the STM32CubeIDE? in STM32CubeIDE (MCUs)
- FreeRTOS SysTick Handler issue after migration in STM32CubeIDE 1.17 in STM32CubeIDE (MCUs)
- UART4 and Ethernet Configuration Issue on STM32H7S7L8HXH_RAMxspi1_ROMxspi2.ld in STM32CubeIDE (MCUs)
- STM32CubeProgrammer 2.18 BUG on STM32H730 in STM32CubeProgrammer (MCUs)