Finding the function beeing interrupted
- Mark as New
- Bookmark
- Subscribe
- Mute
- Subscribe to RSS Feed
- Permalink
- Email to a Friend
- Report Inappropriate Content
2020-12-01 6:30 AM
Hello,
I used to work with IAR.
In IAR call stack, if ever you break into an ISR, the call stack shows you where you were in the "main" code just before the ISR fired.
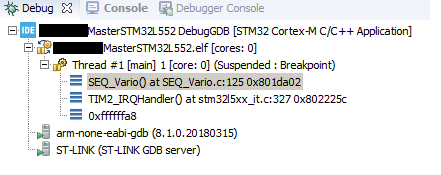
Now, with STM32Cube MX, the call stack only shows the call stack since the root ISR function, but we don't know which function has been interrupted.
How to read this info ?
Thanks.
Best regards,
V.
Solved! Go to Solution.
- Labels:
-
STM32CubeIDE
Accepted Solutions
- Mark as New
- Bookmark
- Subscribe
- Mute
- Subscribe to RSS Feed
- Permalink
- Email to a Friend
- Report Inappropriate Content
2020-12-02 6:05 AM
Hi,
This is a known issue. We have discussed this with Arm a quite long time ago, but back then it was in the context of TZEN=1. The issue seem to be similar with TZEN=0 which I think is news to us.
From your screenshot we can see that you are running the gcc-7 from 2018. We now also deliver the gcc-9 from 2020, however we don't think the issue is fixed there.
The root-cause of the issue is that GDB is not yet cortex-m33 aware with respect to stack unwinding. The 0xffffffa8 is a magical pattern (EXC_RETURN) that GDB does not understand. Hence it cannot properly do the stack unwinding. If you later use TZEN=1, the issue I described in my last post will apply.
So, sorry, I see no way forward with the current versions available of CubeIDE and the bundled toolchains. The only thing I can say is that we have tickets for this and have requested a fix from Arm.
- Mark as New
- Bookmark
- Subscribe
- Mute
- Subscribe to RSS Feed
- Permalink
- Email to a Friend
- Report Inappropriate Content
2020-12-01 7:17 AM
You usually get what you pay for. And the Cube compiler is free ...
You can note down the stacked return address, and cross-check with the map file manually.
Or go back to IAR.
- Mark as New
- Bookmark
- Subscribe
- Mute
- Subscribe to RSS Feed
- Permalink
- Email to a Friend
- Report Inappropriate Content
2020-12-02 12:39 AM
Hi V,
In CubeIDE this should work. This is probably the first report suggesting that it does not.
If you are using an STM32 product where TrustZone is enabled and you get a Secure interrupt which has a call-back in the Non-Secure world. In this case the full stack is not exposed to the Non-Secure world... this is the only known issue I know of, it has been discussed with Arm, but I think that we share the same limitation with IAR and Keil for this quite specific use case.
Let us know more about your setup: Which device? which debug probe? Which ISRs? ...?
- Mark as New
- Bookmark
- Subscribe
- Mute
- Subscribe to RSS Feed
- Permalink
- Email to a Friend
- Report Inappropriate Content
2020-12-02 2:51 AM
Hello Mattias,
Thank you for your answer.
Device : STM32L552 with TrustZone disabled
Debug probe : ST-Link V2
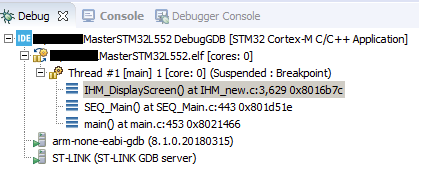
call stack displays normally (up to the "main" function) when not in ISR (see below)

- Mark as New
- Bookmark
- Subscribe
- Mute
- Subscribe to RSS Feed
- Permalink
- Email to a Friend
- Report Inappropriate Content
2020-12-02 6:05 AM
Hi,
This is a known issue. We have discussed this with Arm a quite long time ago, but back then it was in the context of TZEN=1. The issue seem to be similar with TZEN=0 which I think is news to us.
From your screenshot we can see that you are running the gcc-7 from 2018. We now also deliver the gcc-9 from 2020, however we don't think the issue is fixed there.
The root-cause of the issue is that GDB is not yet cortex-m33 aware with respect to stack unwinding. The 0xffffffa8 is a magical pattern (EXC_RETURN) that GDB does not understand. Hence it cannot properly do the stack unwinding. If you later use TZEN=1, the issue I described in my last post will apply.
So, sorry, I see no way forward with the current versions available of CubeIDE and the bundled toolchains. The only thing I can say is that we have tickets for this and have requested a fix from Arm.
