- STMicroelectronics Community
- Knowledge base
- STM32 MCUs
- How to enable FreeRTOS™ Run Time and Stack Usage v...
- Subscribe to RSS Feed
- Mark as New
- Mark as Read
- Bookmark
- Subscribe
- Email to a Friend
- Printer Friendly Page
- Report Inappropriate Content
How to enable FreeRTOS™ Run Time and Stack Usage view
- Subscribe to RSS Feed
- Mark as New
- Mark as Read
- Bookmark
- Subscribe
- Email to a Friend
- Printer Friendly Page
- Report Inappropriate Content
on
2024-01-18
1:53 AM
- edited on
2025-11-26
7:00 AM
by
![]() Laurids_PETERSE
Laurids_PETERSE
In this article, we explore the FreeRTOS™ debugging viewers using STM32CubeIDE and how to enable "Min Free Stack" and "Run Time usage" in each task.
Introduction
To enhance the analysis and validation of the application running on FreeRTOS™, STM32CubeIDE provides various views such as:
- FreeRTOS task list view
- FreeRTOS timers view
- FreeRTOS semaphores view
- FreeRTOS queues view
Each view provides a unique perspective on the application's consumption. For instance, the "Task List View" displays information on priority, memory storage, heap size, and the state of each task by default. Indeed, for optimization purposes, some analyses are not enabled by default and require manual activation. However, they can be easily activated by following a few simple steps. These features provide valuable insights into the application's performance and can aid in identifying potential issues.
To be able to populate the FreeRTOS-related views with detailed information about the RTOS status, some files in the OS kernel must be configured. The following section describes some required configurations. But remember to consult the FreeRTOS reference manual for detailed information.
Many thanks to @YoungKim for proposing this question and to @Walid ZRELLI for pointing a path to the solution, the original post is here: How to enable "Min Free Stack" and "Run Time (%)" ... - STMicroelectronics Community
Required Settings
To validate the information in this article, a NUCLEO-F446 board was used with a very simple FreeRTOS firmware was developed using the STM32CubeIDE 1.13.2. These consist of a blinking LED when the "User Button" is pressed. Meanwhile, USART2 transmits and receives data on the "Serial Terminal" through several independent tasks.
On the STM32CubeMX portion, the first peripheral to be configured is the SYS. Locate and change the debug settings to "Trace Asynchronous Sw." In the same portion, change the "TimeBase Source" from SysTick to another Timer.
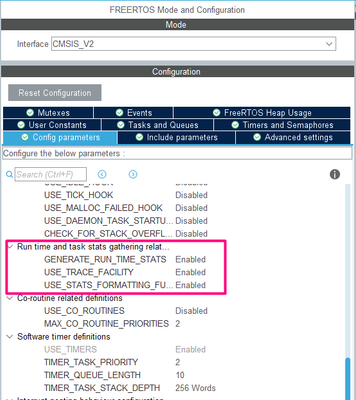
 We must enable the trace information by setting the define configUSE_TRACE_FACILITY to 1 in freeRTOSConfig.h. It results in additional structure members and functions to be included in the build. Furthermore, it enables, for instance, stack checking in the FreeRTOS "Task List View" and lists the semaphore types in the FreeRTOS "Semaphores View." It is also possible to configure the RTOS through STM32CubeMX, as follows:
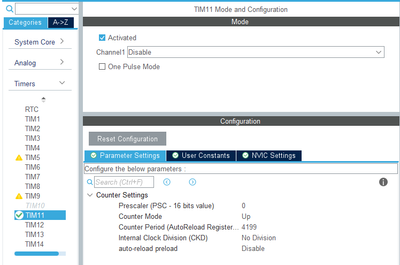
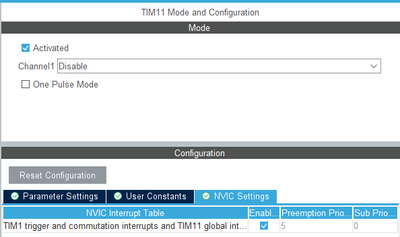
To validate the RTOS runtime statistics, the application must set up an additional time base. It is recommended to have it run at least 10 times faster than the frequency of the clock used to handle the RTOS tick interrupt. In this case, we selected TIM11


NOTE: Any timer can be enabled, except for SysTick or the Time Base Source selected for the HAL driver.
After adding the necessary peripherals, tasks, queues, semaphores, and timers for the application, generate the code and move to the code editing portion.
Required Code Editing
We need to add some code snippets to enable the desired run-time statistics. Navigate to the freertos.c file in the “Src” folder and add the following lines to the code. You can locate the proper position using the USER CODE BEGIN 1:
/* USER CODE BEGIN 1 */
/* Functions needed when configGENERATE_RUN_TIME_STATS is on */
__weak void configureTimerForRunTimeStats(void)
{
	HAL_TIM_Base_Start_IT(&htim11);
}

extern volatile unsigned long ulHighFrequencyTimerTicks;
__weak unsigned long getRunTimeCounterValue(void)
{
return ulHighFrequencyTimerTicks;
}
/* USER CODE END 1 */
We need to increment the ulHighFrequencyTimerTicks to create the stats. By doing so, we can use the chosen IRQ handler inside the stm32f4xx_it.c file, to perform the increment:
/**
  * @brief This function handles TIM1 trigger and commutation interrupts and TIM11 global interrupt.
  */

volatile unsigned long ulHighFrequencyTimerTicks = 0;

void TIM1_TRG_COM_TIM11_IRQHandler(void)
{
  /* USER CODE BEGIN TIM1_TRG_COM_TIM11_IRQn 0 */

  /* USER CODE END TIM1_TRG_COM_TIM11_IRQn 0 */
  HAL_TIM_IRQHandler(&htim11);
  /* USER CODE BEGIN TIM1_TRG_COM_TIM11_IRQn 1 */
  ulHighFrequencyTimerTicks++;
  /* USER CODE END TIM1_TRG_COM_TIM11_IRQn 1 */
}
The application software must call the vQueueAddToRegistry() function to make the queues and semaphores views able to display objects. The function adds an object to the queue registry and takes two parameters. The first parameter is the handle of the queue. The second parameter is a description of the queue, which is presented in the "FreeRTOS-related views." To do this, go to the MX_FREERTOS_Init() function in the freertos.c file and add the referred functions, for this example, these are the ones needed:

To enable the collection of run time statistics, the file freeRTOSConfig.h must include:
- Set the define configGENERATE_RUN_TIME_STATS value to 1.

- Define portCONFIGURE_TIMER_FOR_RUN_TIME_STATS() to call the function that configures a timer. The timer is used for profiling, and define portGET_RUN_TIME_COUNTER_VALUE() to call the function that reads the current value from the profiling timer
/* USER CODE BEGIN 2 */
/* Definitions needed when configGENERATE_RUN_TIME_STATS is on */
#define portCONFIGURE_TIMER_FOR_RUN_TIME_STATS    configureTimerForRunTimeStats
#define portGET_RUN_TIME_COUNTER_VALUE            getRunTimeCounterValue
/* USER CODE END 2 */
FreeRTOS debug views
From the debugger perspective, you can open the FreeRTOS-related views from the menu. To do so, select the menu command:
Window > Show View > Other > FreeRTOS > FreeRTOS Task List
Alternatively, use “Quick Access”. Search for “FreeRTOS” and select from the views. The FreeRTOS Task List view provides detailed information about all available tasks in the target system. The task list is updated automatically every time the target execution is suspended.


There is a column for each type of task parameter and a row for each task. By default, stack analysis (the Min Free Stack column) is disabled due to performance reasons. To enable stack analysis, use the Toggle Stack Checking button in the FreeRTOS Task List view toolbar, as shown in the figure below.

We can see the following view on the Task List tab if debug runs for a while and it's paused:

The column information is changed from Min Free Stack to Stack Usage if the project is built with the following define set in the FreeRTOS.h file (around line 401):

In this case, the full stack usage is presented according to the format Used/Total(%Used) as shown in the image below.

For comparison purposes, here is a screenshot of the Task List View with default settings. We can clearly note the significant data losses.

No additional change occurs on the other different perspectives that are available. The default view for Queue, Semaphore and Timer View are always showing its contents to the fullest:
Queue View:

Timer View:

Semaphore View:

RTOS-kernel-aware debug
The RTOS-kernel-aware debug feature in STM32CubeIDE facilitates support for Microsoft Azure RTOS ThreadX and FreeRTOS™ operating systems, through the use of an RTOS proxy. The STM32CubeIDE includes the RTOS proxy, which can be utilized with an STLINK GDB server, OpenOCD, and Segger J-Link GDB server.
To enable RTOS-kernel-aware debugging, the "debugger" tab in the "Debug Configurations" dialog contains settings to enable and configure the following:
- RTOS proxy
- Driver (RTOS ThreadX or FreeRTOS)
- Port (Cortex® core) and configuration of port number to use with the proxy.


Upon enabling RTOS-kernel-aware debugging and initiating a debug session, all threads are displayed in the debug view. By selecting a thread in the debug view, the current context of the thread is visualized in various views. For example, the variables, registers, and editor views reflect the active stack frame. For example:

Conclusion
After diving deeper on the required settings on FreeRTOS™ kernel and MCU peripheral, it became possible to visualize several additional and useful information. This includes the memory and percentage of the tasks, queues, semaphores, and timers. Additionally, we also explored a little more about the visible threads in debug section.
We hope you enjoyed this article!
Related link
- Mark as Read
- Mark as New
- Bookmark
- Permalink
- Email to a Friend
- Report Inappropriate Content
Hi thanks for article. I am trying to follow your manual step by step; and when I am compiling the project I have next errors:
./Core/Src/main.c: At top level:
../Core/Src/main.c:1634:6: error: redefinition of 'HAL_TIM_PeriodElapsedCallback'
1634 | void HAL_TIM_PeriodElapsedCallback(TIM_HandleTypeDef *htim)
| ^~~~~~~~~~~~~~~~~~~~~~~~~~~~~
../Core/Src/main.c:208:6: note: previous definition of 'HAL_TIM_PeriodElapsedCallback' with type 'void(TIM_HandleTypeDef *)'
208 | void HAL_TIM_PeriodElapsedCallback(TIM_HandleTypeDef* htim2)
| ^~~~~~~~~~~~~~~~~~~~~~~~~~~~~
make: *** [Core/Src/subdir.mk:49: Core/Src/main.o] Error 1
"make -j8 all" terminated with exit code 2. Build might be incomplete.
And this Function have been created automatically:
/**
  * @brief  Period elapsed callback in non blocking mode
  * @note   This function is called  when TIM10 interrupt took place, inside
  * HAL_TIM_IRQHandler(). It makes a direct call to HAL_IncTick() to increment
  * a global variable "uwTick" used as application time base.
  * @PAram  htim : TIM handle
  * @retval None
  */
void HAL_TIM_PeriodElapsedCallback(TIM_HandleTypeDef *htim)
{
  /* USER CODE BEGIN Callback 0 */

  /* USER CODE END Callback 0 */
  if (htim->Instance == TIM10) {
    HAL_IncTick();
  }
  /* USER CODE BEGIN Callback 1 */
- Mark as Read
- Mark as New
- Bookmark
- Permalink
- Email to a Friend
- Report Inappropriate Content
Ok I have solved problem finally! My mistake. I have created
void HAL_TIM_PeriodElapsedCallback(TIM_HandleTypeDef *htim)
Function earlier in my code by using on Timer 2.
I have deleted my function and put everything into the new generated callback.
Everything works now how it expected. thanks a lot for the tutorial.
- Mark as Read
- Mark as New
- Bookmark
- Permalink
- Email to a Friend
- Report Inappropriate Content
Great! Nice job!
- Mark as Read
- Mark as New
- Bookmark
- Permalink
- Email to a Friend
- Report Inappropriate Content
Great article!
For anyone wondering why no runtime percentage stats are shown, try checking your optimization level. It did not work for me on -Ofast
- Mark as Read
- Mark as New
- Bookmark
- Permalink
- Email to a Friend
- Report Inappropriate Content
Great,
Any way to achieve this for ThreadX? Does ThreadX has mechanism to gather the MCU usage of threads?
- Mark as Read
- Mark as New
- Bookmark
- Permalink
- Email to a Friend
- Report Inappropriate Content
Dear Bruno,
many thanks for your valuable guide. I'm working with a M0+ core (P/N STM32G0B1xx).
I wonder if there's any way to have a live update of the rtos related statistics, or if FreeRTOS views refresh happens only when pausing the execution.
If not, is it a limitation due to the limited trace features of the M0 core or the IDE?
We're using STM32CubeIDE environment.
Many thanks for your feedback,
E.
- Mark as Read
- Mark as New
- Bookmark
- Permalink
- Email to a Friend
- Report Inappropriate Content
Hi @ebenetti ,
The view is updated automatically each time the target execution is suspended, but I'm not aware of any solution from us or partners that allows live update on RTOS related statistics. This is not a limitation due to the M0+ core.
Yes, you can have a very similar settings for ThreadX, once in debug mode, you can click on [Window][Show View][ThreadX] and select the resources you want to monitor:
ThreadX also allows you to enable TraceX, which is a great way to evaluate the behavior of the RTOS during a certain period of time. That works similar to a log, rather than a regular update during the debug session, but it can be quite helpful. We have two articles talking about it, in case you want to look>
How can I add TraceX support in STM32CubeIDE? - STMicroelectronics Community
How can I automate TraceX reads from STM32CubeIDE? - STMicroelectronics Community
Best Regards
- Mark as Read
- Mark as New
- Bookmark
- Permalink
- Email to a Friend
- Report Inappropriate Content
Very useful article for collecting more information to analyze !!!
I love it, Thank you a lot.
Kudos
- Mark as Read
- Mark as New
- Bookmark
- Permalink
- Email to a Friend
- Report Inappropriate Content
This is great. Everything works except the thread view, which only shows one thread. Any tips about how to debug it?
I am using FreeRTOS on a WB55. I have RTOS Proxy enabled and 15 threads running.

