- STMicroelectronics Community
- Knowledge base
- STM32 MCUs
- How can I automate TraceX reads from STM32CubeIDE?
- Subscribe to RSS Feed
- Mark as New
- Mark as Read
- Bookmark
- Subscribe
- Email to a Friend
- Printer Friendly Page
- Report Inappropriate Content
How can I automate TraceX reads from STM32CubeIDE?
- Subscribe to RSS Feed
- Mark as New
- Mark as Read
- Bookmark
- Subscribe
- Email to a Friend
- Printer Friendly Page
- Report Inappropriate Content
on
2021-09-30
9:46 AM
- edited on
2025-11-26
6:08 AM
by
![]() Laurids_PETERSE
Laurids_PETERSE
To make TraceX automatically fetch information, we can create a batchfile and run it with the debug session of the STM32CubeIDE
Goal: Add TraceX support to STM32CubeIDE using X-CUBE-AZRTOS-H7 and make it acquire the buffer automatically
Although the example is using the NUCLEO-H723ZG, you can use the same steps for other STM32H7 based boards. The main differences are usually pinout and clock configuration.
This article will show you how to add TraceX support in a simple project that already uses ThreadX with the X-CUBE-AZRTOS-H7 software package.
TraceX allows a post mortem analysis of the thread sequence occurred during firmware execution, for more information on how to add it without the automatic part, please refer to this article:
-
Prerequisites:
- Install TraceX using Microsoft’s Store
- Install STM32CubeIDE and software package X-CUBE-AZRTOS-H7
- Install STM32CubeProgrammer
- Have a working ThreadX project in STM32CubeIDE that uses the software package X-CUBE-AZRTOS-H7 or similar
- You can refer to this article on how to create one from scratch
- Have a working project with TraceX capability
-
How to make it work:
- Open your STM32CubeIDE project with TraceX and ThreadX enabled and go to the Debug configurations:

From this point, select the application and click on the “Debugger” Tab:

Scroll down and check the Shared STLINK option:

This option allows you to use ST-LINK with both the STM32CubeIDE for debugging and at the same time with the STM32CubeProgrammer, which can read the trace buffer content.
- Now we need to place the buffer used for the trace in a fixed memory region, so the address is known to us and can be easily found and mapped for the STM32CubeProgrammer later on
In order to do this, we need to edit the linker script to add it. If you are using the same settings from this article, this step is already implemented.

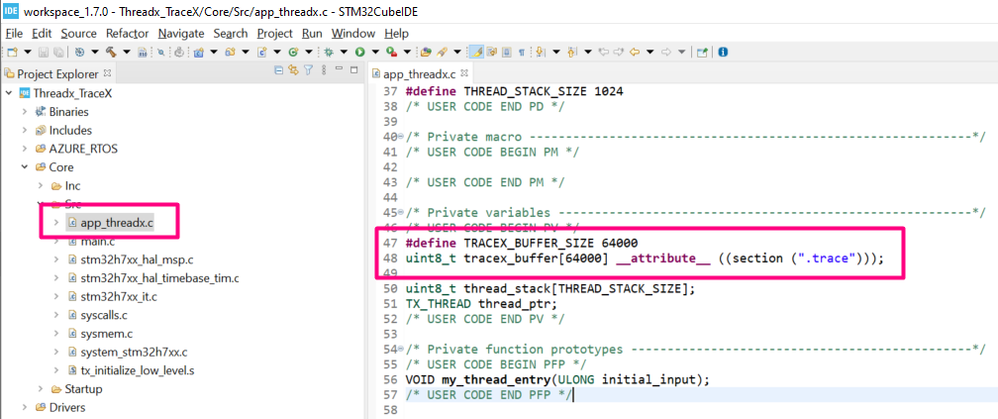
Make sure that the buffer used for the trace is placed inside this newly created section, this can be done by using the __attribute__

- Create a *.bat file, in this example, it will be called “trace_read.bat”. Make sure to place it into the same place as project *.IOC file / root folder for the STM32CubeIDE project
The content of the trace_read.bat assumes that the STM32CubeProgrammer installation path was the default c:\Program Files\STMicroelectronics\STM32Cube\STM32CubeProgrammer\, if this is not your case, please make sure to properly edit it.
The content of the trace_read.bat is:
"c:\Program Files\STMicroelectronics\STM32Cube\STM32CubeProgrammer\bin\STM32_Programmer_CLI.exe" -c port=SWD mode=HOTPLUG shared -u 0x24000000 64000 .\Debug\tracex.bincopy .\Debug\tracex.bin .\Debug\tracex.trxExplaining the commands used:
The first portion of the command is just to make the current directory to the installation folder of the STM32CubeProgrammer
The second portion command calls the STM32CubeProgrammer CLI and uses the SWD interface to make a connection without resetting the MCU, thus the setting called HOTPLUG and, since the ST-LINK is shared with the STM32CubeIDE, the information is also added:
-
c port=SWD mode=HOTPLUG sharedThis will read 64000 bytes started from address 0x24000000 and store that to file .\Debug\tracex.bin
-
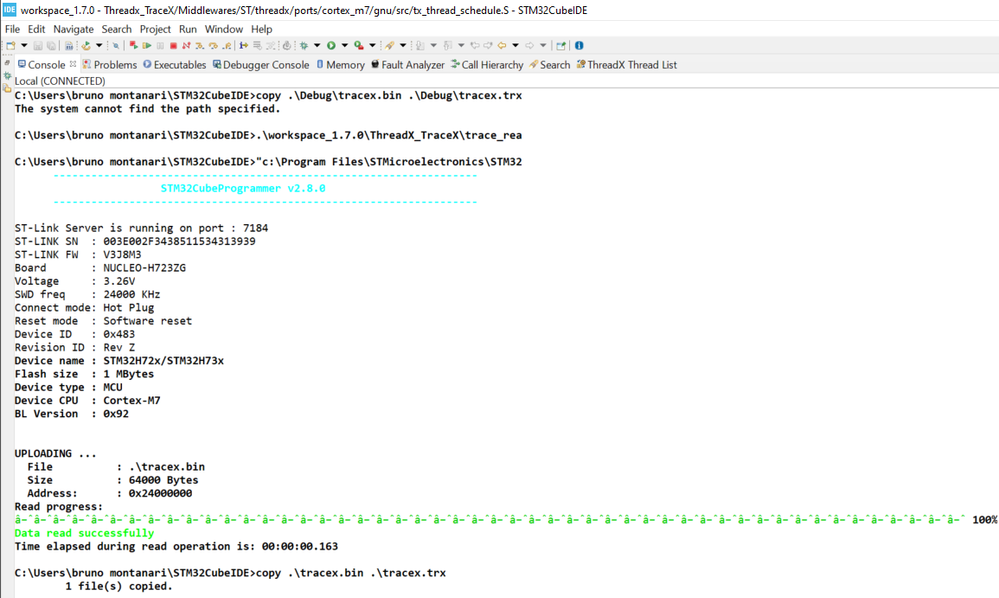
u 0x24000000 64000 .\Debug\tracex.bin- Enter in debug mode and run the application, after a while the trace buffer will be filled as the application progress, so you can run the trace_read.bat, while still in debug, to create your tracex.trx (TraceX file)
- You can call the trace_read.bat by double clicking in it
- You can call it by first issuing the cmd.exe

-
- You can open a local console from within the STM32CubeIDE
In the lower left corner, locate and click to create a new Command Shell Console:

Select the connection to be local:

On the terminal, change the directory to be in the project’s folder and then call the trace_read.bat from there:

- Open the TraceX and load the tracex.trx and enjoy :)


-
Useful links:
- STM32CubeIDE: https://www.st.com/en/development-tools/stm32cubeide.html
- STM32CubeProgrammer: https://www.st.com/en/development-tools/stm32cubeprog.html
- NUCLEO-H723ZG: https://www.st.com/en/evaluation-tools/nucleo-h723zg.html
- ThreadX user guide https://docs.microsoft.com/en-us/azure/rtos/threadx/about-this-guide
- ThreadX api description https://docs.microsoft.com/en-us/azure/rtos/threadx/chapter4
- Github: https://github.com/STMicroelectronics/x-cube-azrtos-h7
- TraceX user guide: https://docs.microsoft.com/en-us/azure/rtos/tracex/
- TraceX article: https://community.st.com/s/article/how-can-i-add-tracex-support-in-stm32cubeide
-
Conclusion:
-
- Adding the ThreadX component in STM32CubeMX/STM32CubeIDE
- Add TraceX support and apply minor configuration in STM32CubeMX/ STM32CubeIDE
- Generate the code from STM32CubeMX/ STM32CubeIDE
- This will update the project structure with all needed files
- Create the size of the buffer that will storage the trace during firmware execution
- Automatically export this data using STM32CubeProgrammer to be analyzed on TraceX
- Have fun :)