- STMicroelectronics Community
- STM32 MCUs
- STM32 MCUs Products
- Debugging JTAG daisy chain
- Subscribe to RSS Feed
- Mark Topic as New
- Mark Topic as Read
- Float this Topic for Current User
- Bookmark
- Subscribe
- Mute
- Printer Friendly Page
Debugging JTAG daisy chain
- Mark as New
- Bookmark
- Subscribe
- Mute
- Subscribe to RSS Feed
- Permalink
- Email to a Friend
- Report Inappropriate Content
2020-12-08 6:42 AM
Hello, I have a 4 identical microcontrollers daisy chain wich seems to work...exept I detect 8 devices?... My setup is the folowing...I have a segger J-link edu mini and 4 wire JTAG. basically I dont got JTRST but NRST connected to the J-link... In tis event should my reset strategy be Type 0:Normal or None?? Boot 0 is shorted to GND.
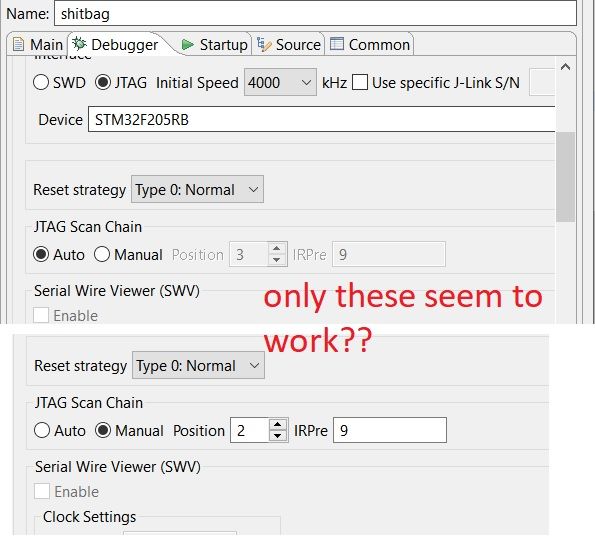
Something seems to work, as I can enter the debugging session and get this log below. But my true goal is to precisely select ny microcontroller on this chain and debug this and get to work. I seem to be only able to program tap #auto(position 0?) and position 2... Why IRPre9?? No idea...Saw this in a post.
J-Link found 8 JTAG devices, Total IRLen = 36
JTAG ID: 0x4BA00477 (Cortex-M3)
Connected to target
Waiting for GDB connection...Connected to 127.0.0.1
Reading all registers
Read 4 bytes @ address 0x080004D8 (Data = 0xB580E7FE)
Read 2 bytes @ address 0x080004D8 (Data = 0xE7FE)
Connected to 127.0.0.1
Reading all registers
Anyways, this is not my main problem, I am just confused as to why I get this effect, no numerical combination of position and IRPre seem to work.
Any help would be appreciated, Please shed light on this issue?
- Labels:
-
DEBUG
-
STM32F2 Series
- Mark as New
- Bookmark
- Subscribe
- Mute
- Subscribe to RSS Feed
- Permalink
- Email to a Friend
- Report Inappropriate Content
2020-12-08 7:44 AM
helllloooooooooooooooooooooooooooo
- Mark as New
- Bookmark
- Subscribe
- Mute
- Subscribe to RSS Feed
- Permalink
- Email to a Friend
- Report Inappropriate Content
2020-12-08 8:01 AM
A CortexM Device Jtag chain is already two devices. One for debug access and one for Boundary Scan/IO-access.JTAG ID:0x4BA00477 and similar is Cortex-M3debug. 0x064xx041 are the boundary scan devices.
- Mark as New
- Bookmark
- Subscribe
- Mute
- Subscribe to RSS Feed
- Permalink
- Email to a Friend
- Report Inappropriate Content
2020-12-08 2:06 PM
so what are my 4 numerial possibilities to make this work and go on?
I have 2-9 and auto...Missing some.
- Mark as New
- Bookmark
- Subscribe
- Mute
- Subscribe to RSS Feed
- Permalink
- Email to a Friend
- Report Inappropriate Content
2020-12-08 2:11 PM
List the chain and tell your debugger to connect to the right device.
- Mark as New
- Bookmark
- Subscribe
- Mute
- Subscribe to RSS Feed
- Permalink
- Email to a Friend
- Report Inappropriate Content
2020-12-08 2:15 PM
What do you mean? How?
I am using these 2 tickboxes, that is all.
- Mark as New
- Bookmark
- Subscribe
- Mute
- Subscribe to RSS Feed
- Permalink
- Email to a Friend
- Report Inappropriate Content
2020-12-08 3:03 PM
Learn about Jtag chains. Some tools offer you more insight about the chain. I do not know about the segger tools. There are probably 5 bit used for the Debug TAP and 4 bits for the Boundary Scan TAP. So you have 9 bits before then second chip.
- Build and debug code on STMCUBE IDE using IAR tool chain as compiler in STM32CubeIDE (MCUs)
- Nucleo STM32C071RB with WS2812b issue in Others: STM32 MCUs related
- Solder Bridge Configuration For Stacking Two IHM02A1 Boards in STM32 MCUs Motor control
- STM32H753 SDMMC in SDIO mode producing repeated DATEND interrupt without new request in STM32 MCUs Embedded software
- Best MCU to use for BMS in Others: STM32 MCUs related
