


How to debug the STM32N6 using VS Code
- June 22, 2026 at 4:20 PM
- 17 replies
- 9634 views
Summary
This article provides a detailed guide on using VS Code to debug code running from external serial flash on the STM32N6. It covers setting up the development environment, setting up the project with CMake, configuring the debugger within VS Code, and validating the setup.
Introduction
To debug code running from external serial flash effectively, the external memory must be configured in memory-mapped mode. The first stage bootloader (FSBL), running from AXI-SRAM2, initializes the XSPI interface, enables memory-mapped mode, and jumps to the application stored in external flash. Debugging starts with placing the debugger program on this external memory, allowing seamless execution and inspection directly from flash.
A key limitation to be aware of is that breakpoints cannot be set in application code located in external memory before the FSBL configures the memory mapping. Once the FSBL completes this setup and the debugger enters debug mode, breakpoints function normally. This guide covers environment setup, debugger configuration, project setup with CMake, and tips to work around these constraints for an efficient debugging workflow in VS Code.
1. Prerequisites
This article requires that you have the following installed:
- Visual Studio Code
- STM32CubeIDE for Visual Studio Code (VS Code Extension)
- Cortex-Debug (VS Code Extension)
- STM32CubeProgrammer
- STM32CubeCLT
- STM32CubeMX
- The latest version of the STM32N6 HAL driver
2. Hardware setup
The hardware used to showcase is the STM32N6570-DK. Make sure that you have it in DEV boot mode to program the code.
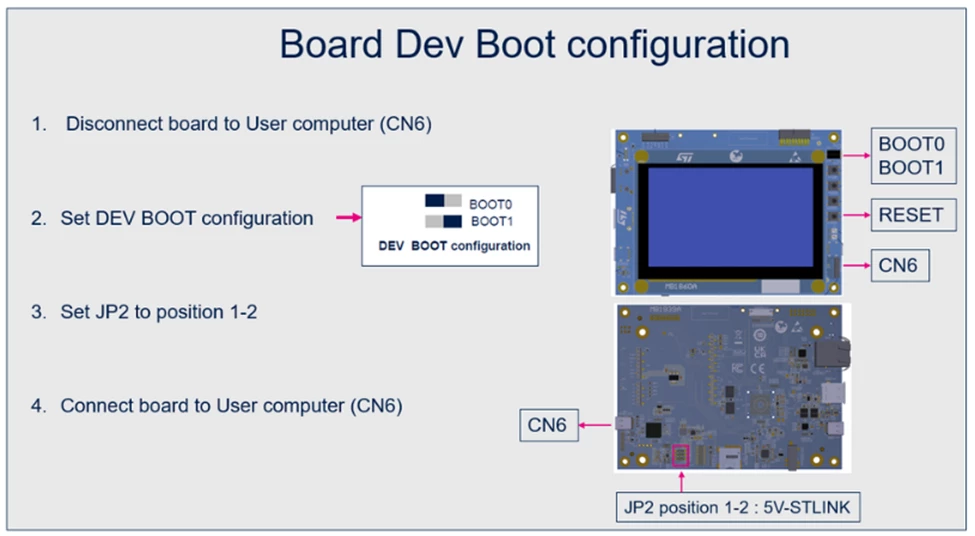
3. Create an STM32N6 CMake project
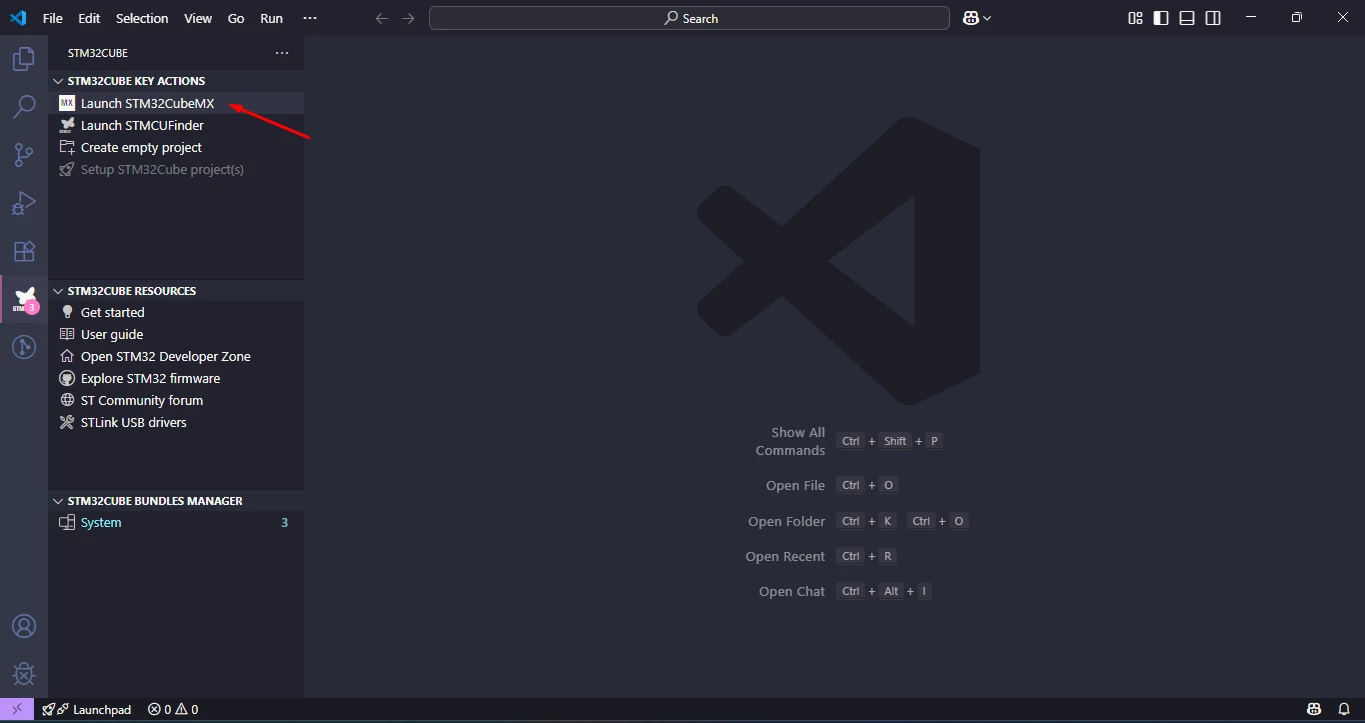
- Create a new STM32CubeMX project, open VS Code, and click on [Launch STM32CubeMX]:
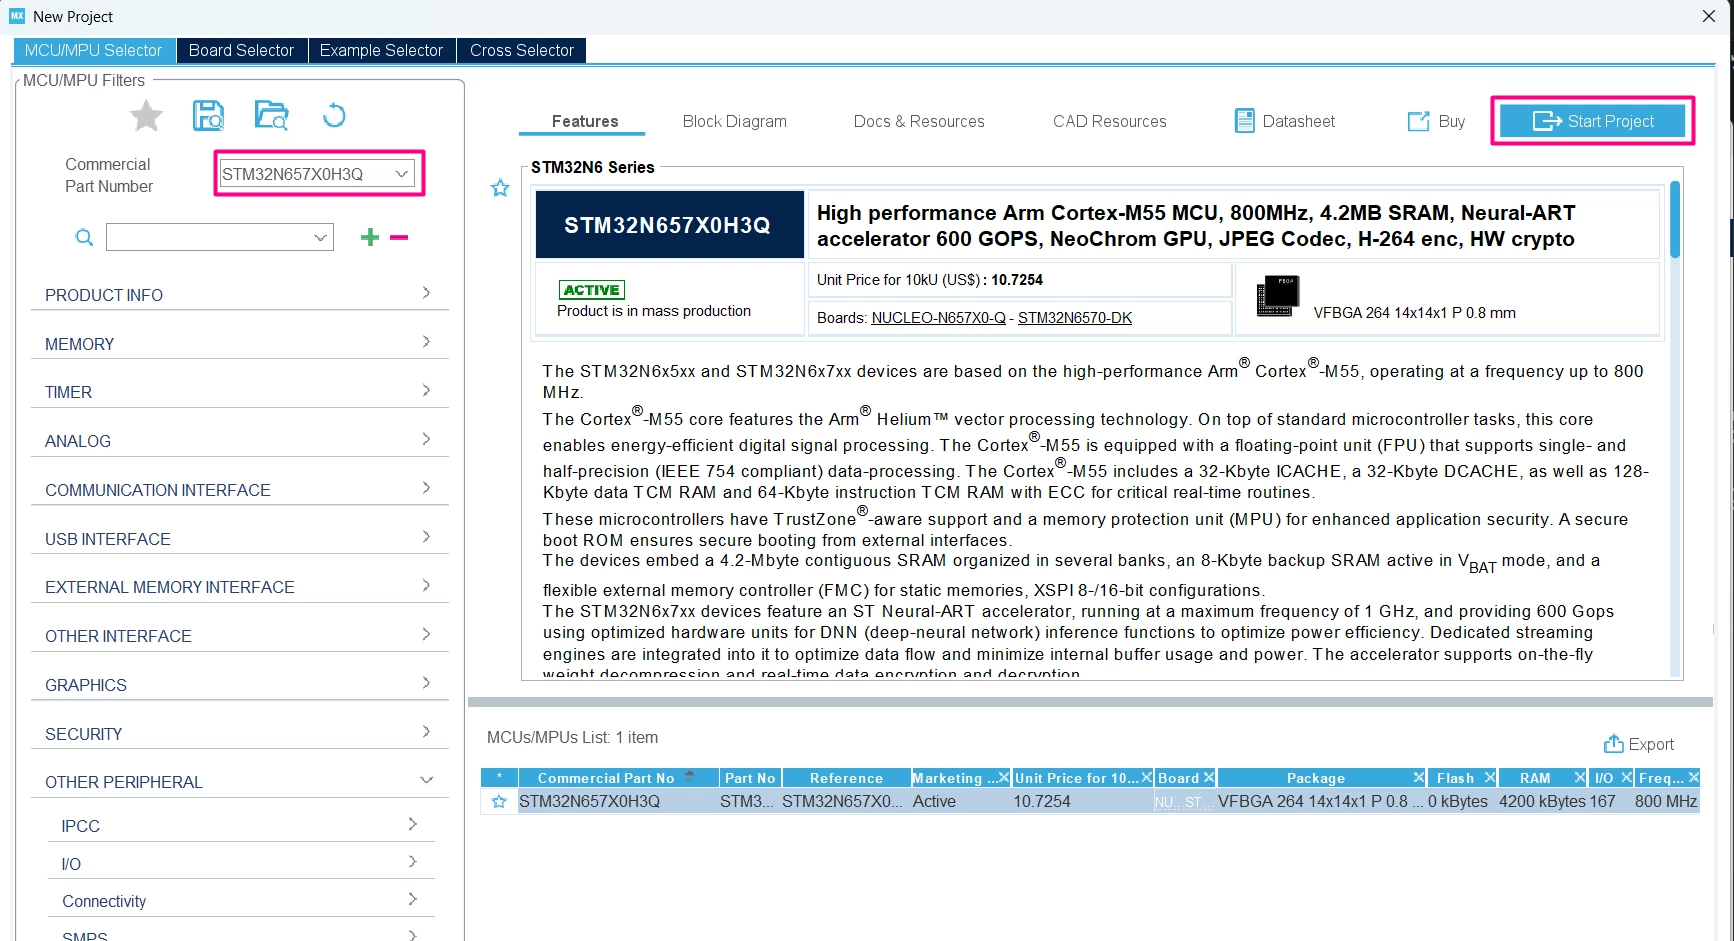
- Select the [STM32N657X0H3Q]:
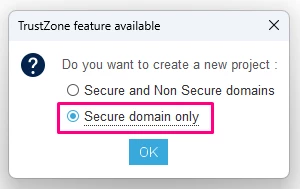
- Select [Secure domain only]:
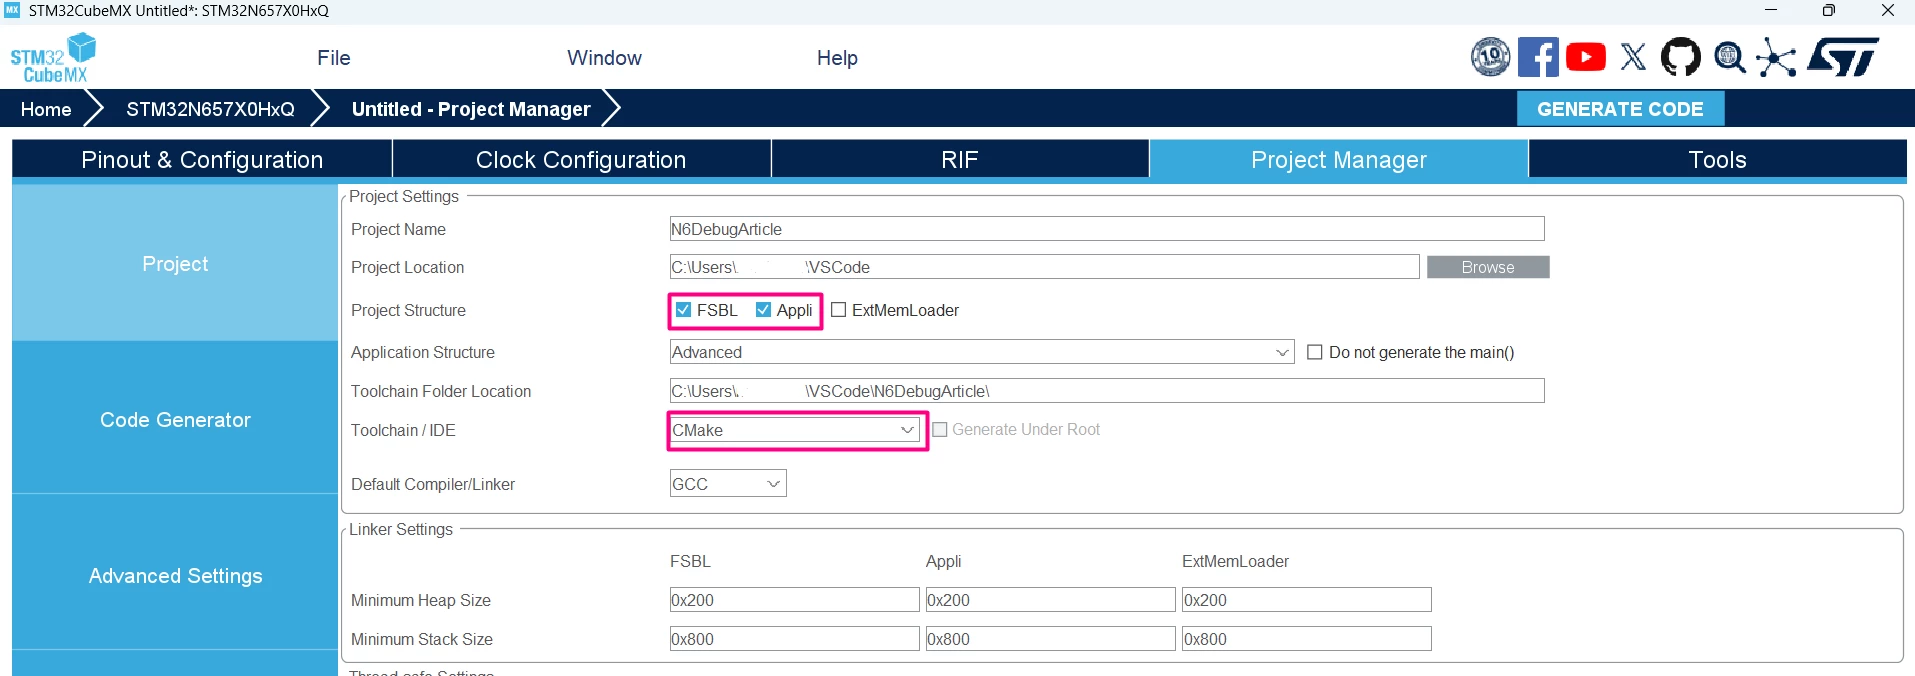
- Before the code generation, select the CMake toolchain:
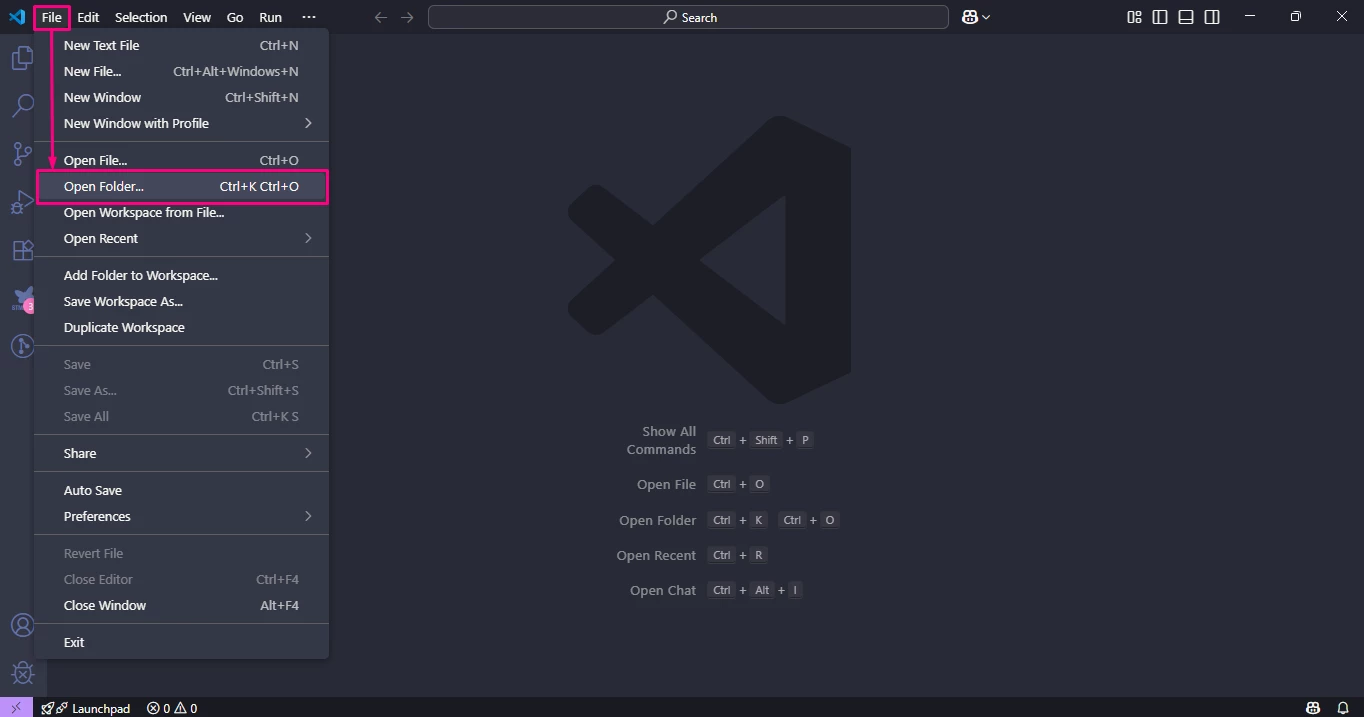
- In VS Code, import the project folder:
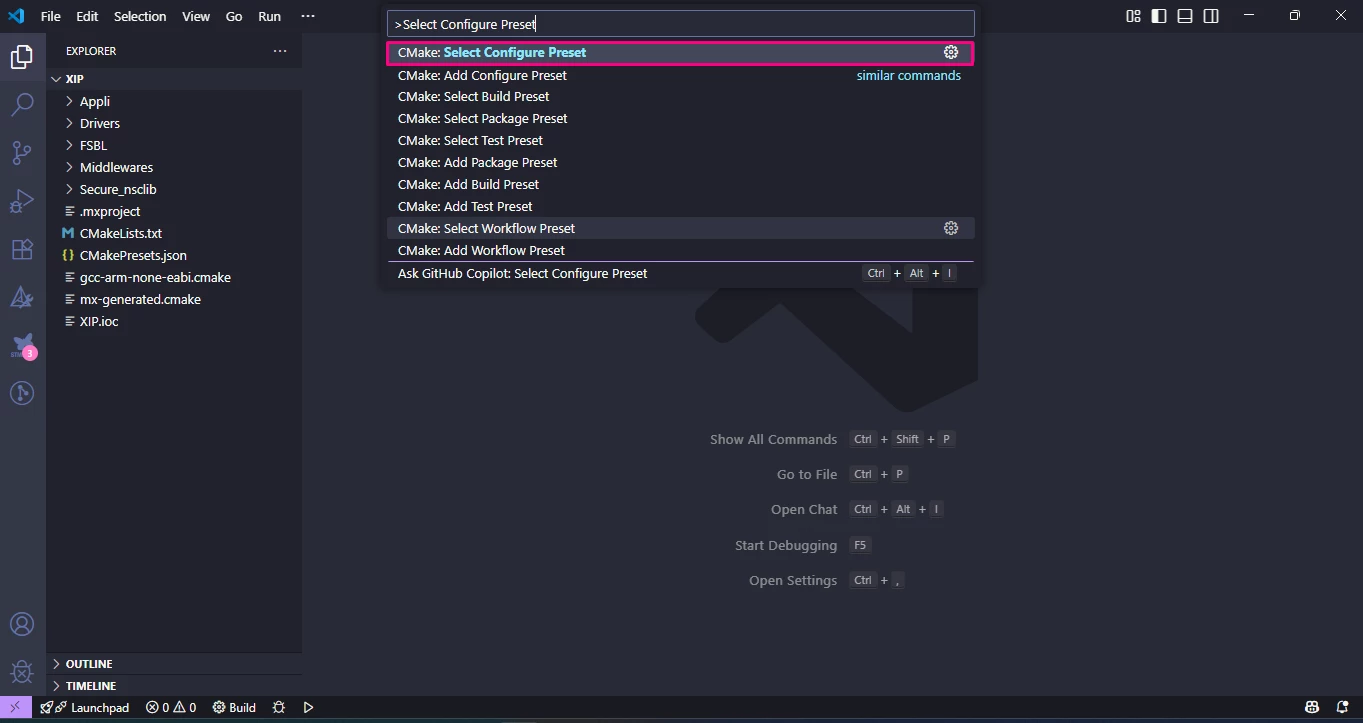
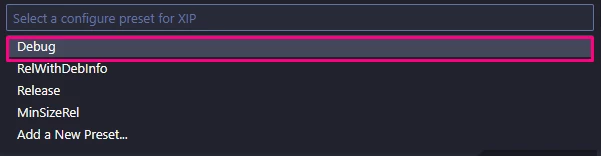
- Configure the preset [Debug] by pressing Ctrl+Shift+P and type/select [Select Configure Preset] then click on [Debug]:
- Configure CMake discovered Project as STM32Cube Project:
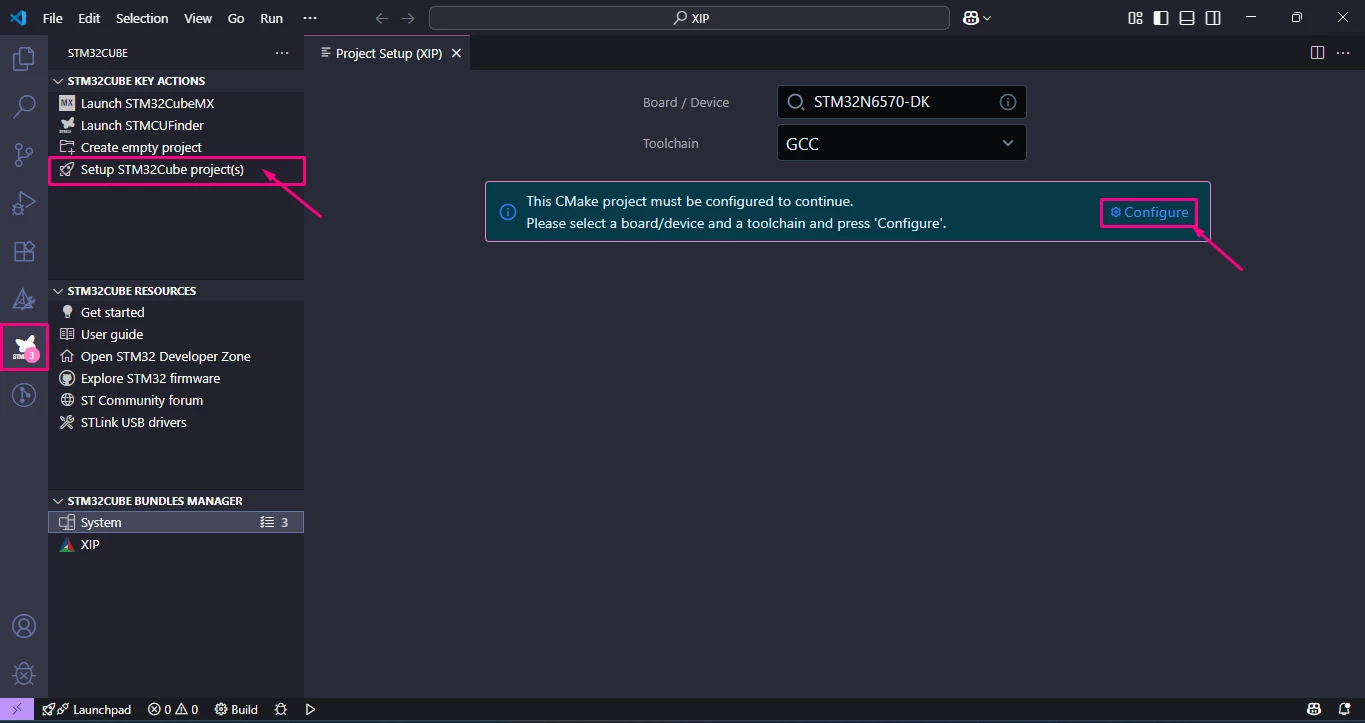
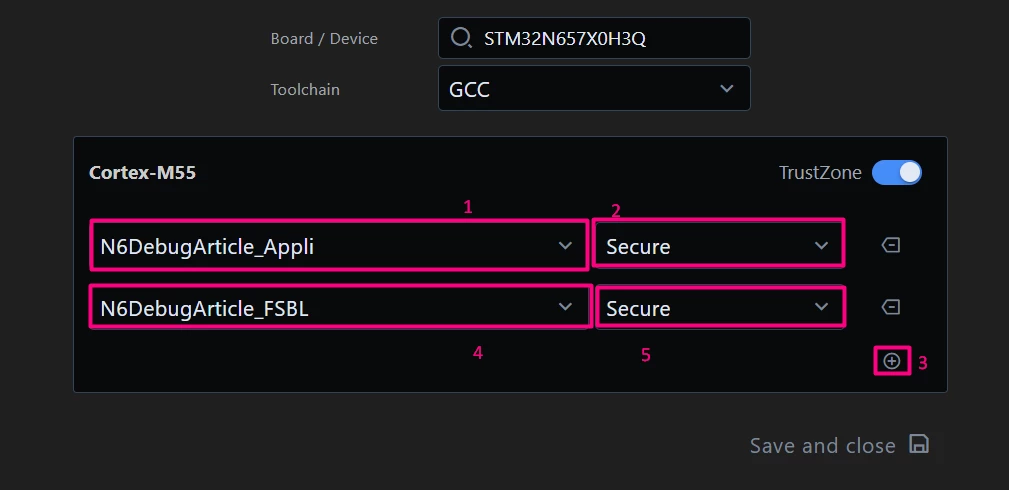
- Add [PROJECT_NAME_Appli] and [PROJECT_NAME_FSBL] to your environment, save and close:
4. Code editing and post build commands
In the [Appli] project, locate the main.c file and add the toggle LED function call in its main loop:
/* Infinite loop */
/* USER CODE BEGIN WHILE */
while (1)
{
/* USER CODE END WHILE */
HAL_GPIO_TogglePin(GREEN_LED_GPIO_Port, GREEN_LED_Pin);
HAL_Delay(200);
/* USER CODE BEGIN 3 */
}
/* USER CODE END 3 */
}
As described here, it is possible to add post-build steps to generate the *.bin files and sign the binaries for both projects. However, some debugging extensions used in VS Code only support .elf files for debug image loading.
Because of that, even though the trusted binaries are generated in .bin format, it is useful to convert them back into .elf files as part of the build process. This allows the trusted image to remain compatible with tools and debug extensions that expect an ELF input while still preserving the signed binary payload.
To address this, a custom post-build command can be added to convert the signed .bin file back into an .elf file at the correct target address.
Example for the [Appli] image:
# Convert the signed Appli .bin back to .elf
add_custom_command(
TARGET ${CMAKE_PROJECT_NAME}
POST_BUILD
COMMAND ${CMAKE_OBJCOPY} -I binary -O elf32-littlearm -B arm --change-addresses=0x70100000 ${APPLI_OUTPUT} ${CMAKE_BINARY_DIR}/Appli-trusted.elf
COMMENT "Converting signed .bin back to .elf in address [0x70100000]"
)
This custom command takes the signed .bin output and repackages it into an .elf file, assigning it the proper load address, in this case 0x70100000 for the [Appli] image.
The result is a trusted ELF image that can be used by debugging tools that require ELF files, while still matching the signed binary content expected by the boot flow.
In short, the post-build flow becomes:
- build the original project ELF
- convert the ELF into a raw .bin file
- sign the .bin file to generate the trusted binary
- convert the signed trusted .bin back into an .elf file for debug tool compatibility
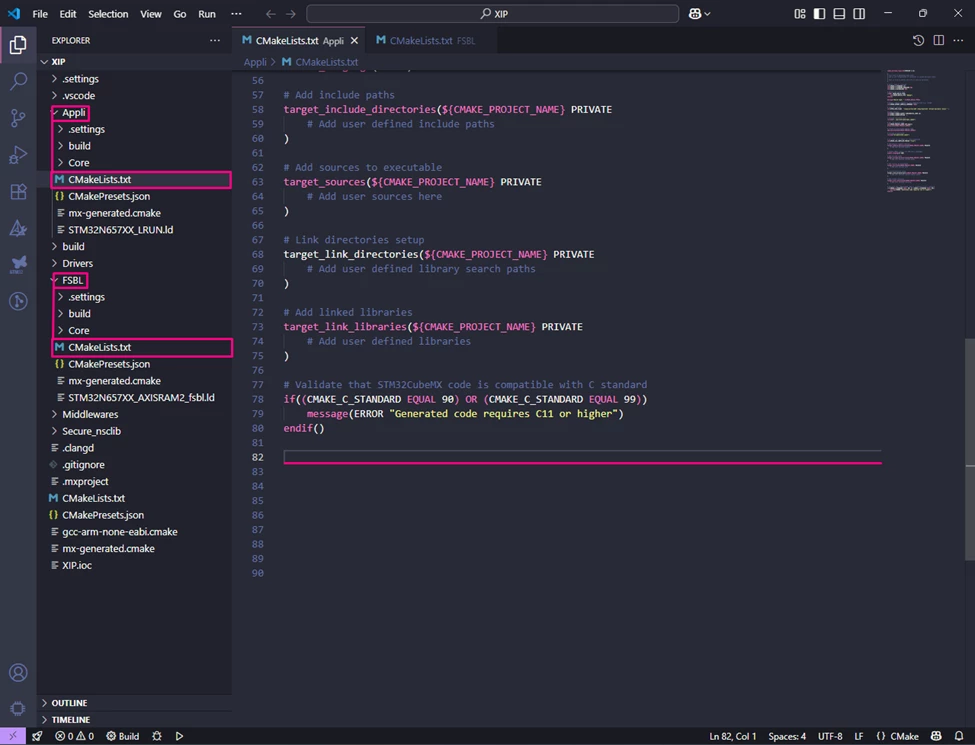
The same principle applies to both the [FSBL] and [Appli] projects, so equivalent post-build commands should be added to both CMakeLists.txt files.
4.1 Edit the FSBL post build
Starting from STM32CubeProgrammer version 2.21.0 a new parameter is needed "-align". Please make sure you use the updated command, as follows:
# Specify the output ELF file
set(TARGET_ELF "${CMAKE_BINARY_DIR}/${CMAKE_PROJECT_NAME}.elf")
# Command to generate .bin file
add_custom_command(
 TARGET ${CMAKE_PROJECT_NAME}
 POST_BUILD
 COMMAND ${CMAKE_OBJCOPY}
-O binary ${TARGET_ELF} ${CMAKE_BINARY_DIR}/${CMAKE_PROJECT_NAME}.bin
 COMMENT "Generating .bin file"
)

# Define the paths to the STM32 Signing Tool and the input/output files
set(SIGNING_TOOL "C:/Program Files/STMicroelectronics/STM32Cube/STM32CubeProgrammer/bin/STM32_SigningTool_CLI.exe")

# Define the input and output files for FSBL
set(FSBL_INPUT "${CMAKE_BINARY_DIR}/${CMAKE_PROJECT_NAME}.bin")
set(FSBL_OUTPUT "${CMAKE_BINARY_DIR}/FSBL-trusted.bin")

# Add a post-build step to sign the FSBL binary
add_custom_command(
 TARGET ${CMAKE_PROJECT_NAME}
 POST_BUILD
 COMMAND ${CMAKE_COMMAND} -E echo y > input.txt
 COMMAND "${SIGNING_TOOL}" -bin "${FSBL_INPUT}" -nk -of 0x80000000 -t fsbl -o "${FSBL_OUTPUT}" -hv 2.3 -align -dump "${FSBL_OUTPUT}" < input.txt
 WORKING_DIRECTORY "${CMAKE_BINARY_DIR}"
 COMMENT "Signing FSBL binary: ${FSBL_INPUT} -> ${FSBL_OUTPUT}"
)

# Convert the signed FSBL .bin back to .elf
add_custom_command(
 TARGET ${CMAKE_PROJECT_NAME}
 POST_BUILD
 COMMAND ${CMAKE_OBJCOPY} -I binary -O elf32-littlearm -B arm --change-addresses=0x70000000 ${FSBL_OUTPUT} ${CMAKE_BINARY_DIR}/FSBL-trusted.elf
 COMMENT "Converting signed FSBL .bin back to .elf in address [0x70000000]"
)
4.2 Edit the Appli post build
Starting from STM32CubeProgrammer version 2.21.0 a new parameter is needed "-align". Please make sure you use the updated command, as follows:
# Specify the output ELF file
set(TARGET_ELF "${CMAKE_BINARY_DIR}/${CMAKE_PROJECT_NAME}.elf")
# Command to generate .bin file
add_custom_command(
 TARGET ${CMAKE_PROJECT_NAME}
 POST_BUILD
 COMMAND ${CMAKE_OBJCOPY} -O binary ${TARGET_ELF} ${CMAKE_BINARY_DIR}/${CMAKE_PROJECT_NAME}.bin
 COMMENT "Generating .bin file"
)

# Define the paths to the STM32 Signing Tool and the input/output files
set(SIGNING_TOOL "C:/Program Files/STMicroelectronics/STM32Cube/STM32CubeProgrammer/bin/STM32_SigningTool_CLI.exe")
# Define the input and output files for Appli
set(APPLI_INPUT "${CMAKE_BINARY_DIR}/${CMAKE_PROJECT_NAME}.bin")
set(APPLI_OUTPUT "${CMAKE_BINARY_DIR}/Appli-trusted.bin")

# Add a post-build step to sign the Appli binary
add_custom_command(
 TARGET ${CMAKE_PROJECT_NAME}
 POST_BUILD
 # Step 1: Create a file with 'y'
 COMMAND ${CMAKE_COMMAND} -E echo y > "${CMAKE_BINARY_DIR}/input.txt"
 # Step 2: Run the signing tool, redirecting input from the file
 COMMAND "${SIGNING_TOOL}" -bin "${APPLI_INPUT}" -nk -of 0x80000000 -t fsbl -o "${APPLI_OUTPUT}" -hv 2.3 -align -dump "${APPLI_OUTPUT}" < "${CMAKE_BINARY_DIR}/input.txt"
 WORKING_DIRECTORY "${CMAKE_BINARY_DIR}"
 COMMENT "Signing Appli binary: ${APPLI_INPUT} -> ${APPLI_OUTPUT}"
)

# Convert the signed Appli .bin back to .elf
add_custom_command(
 TARGET ${CMAKE_PROJECT_NAME}
 POST_BUILD
 COMMAND ${CMAKE_OBJCOPY} -I binary -O elf32-littlearm -B arm --change-addresses=0x70100000 ${APPLI_OUTPUT} ${CMAKE_BINARY_DIR}/Appli-trusted.elf
 COMMENT "Converting signed .bin back to .elf in address [0x70100000]"
)
4.3 Linker script for execute in place (XIP)
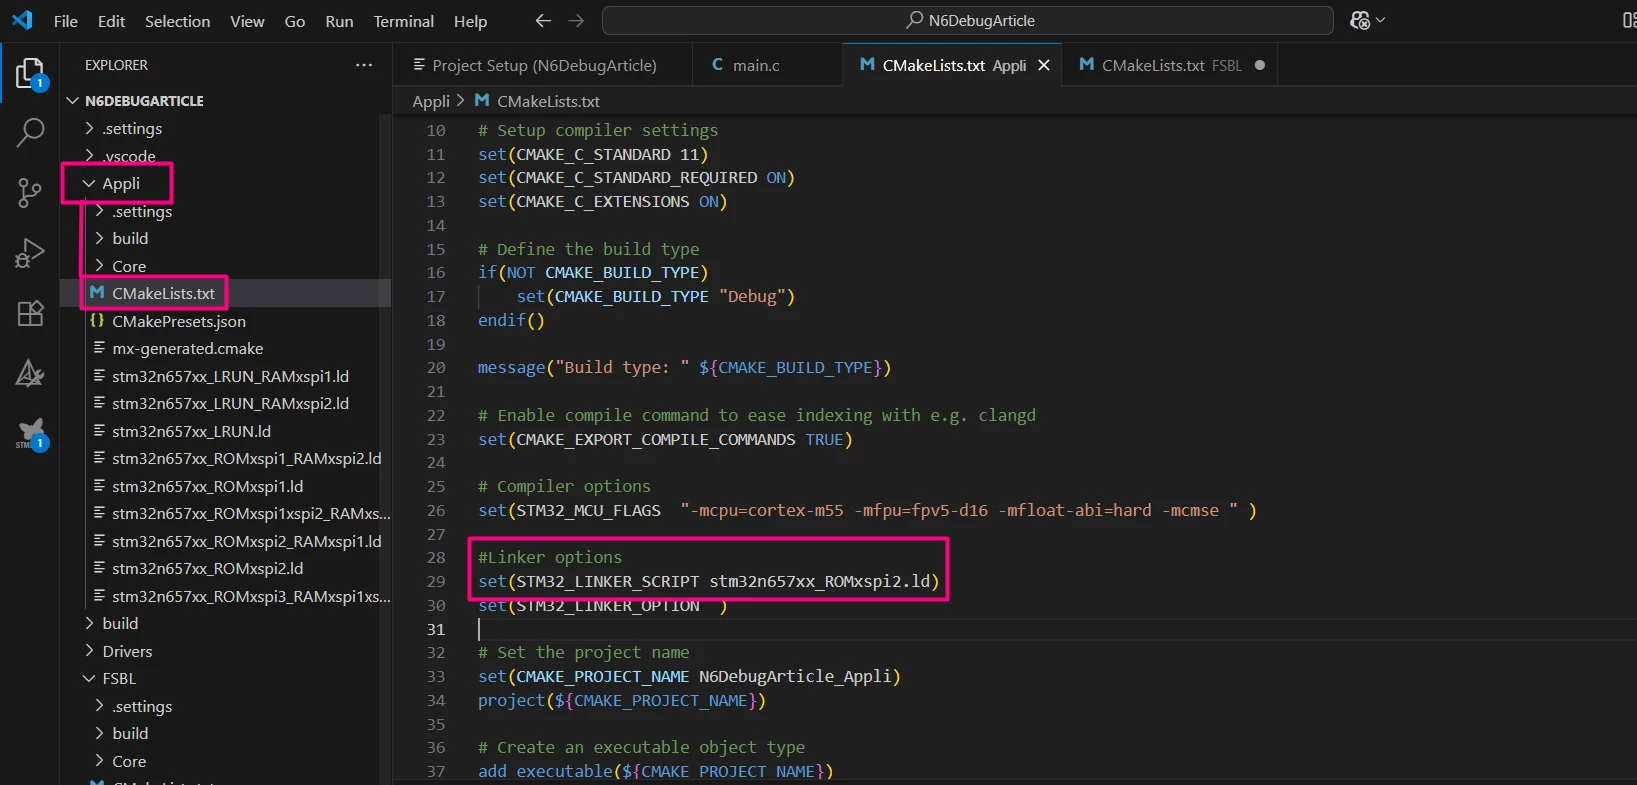
The default linker script generated by the CMake for the [Appli] project is configured for the selected operation configured in the STM32CubeMX’s EXTMEM_MANAGER, where the selected was XIP. Double check that the linker script used in [Appli] CMakeLists.txt is indeed the correct one:
Note: STM32CubeMX version 6.15 has a minor bug on the linker script creation for CMake that causes a build error on VS Code. I recommend changing the content of said linker script with the equivalent one available in our GitHub here or use the attached on in this article (available at the end of the article.)
5. Build the project
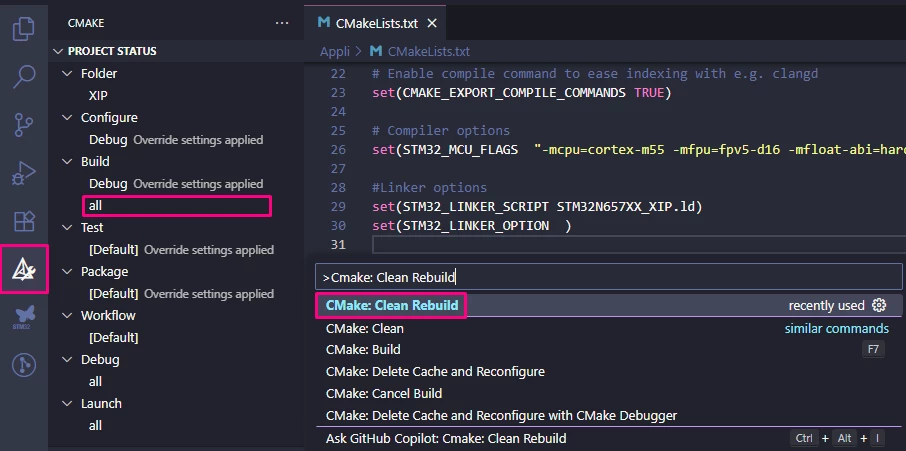
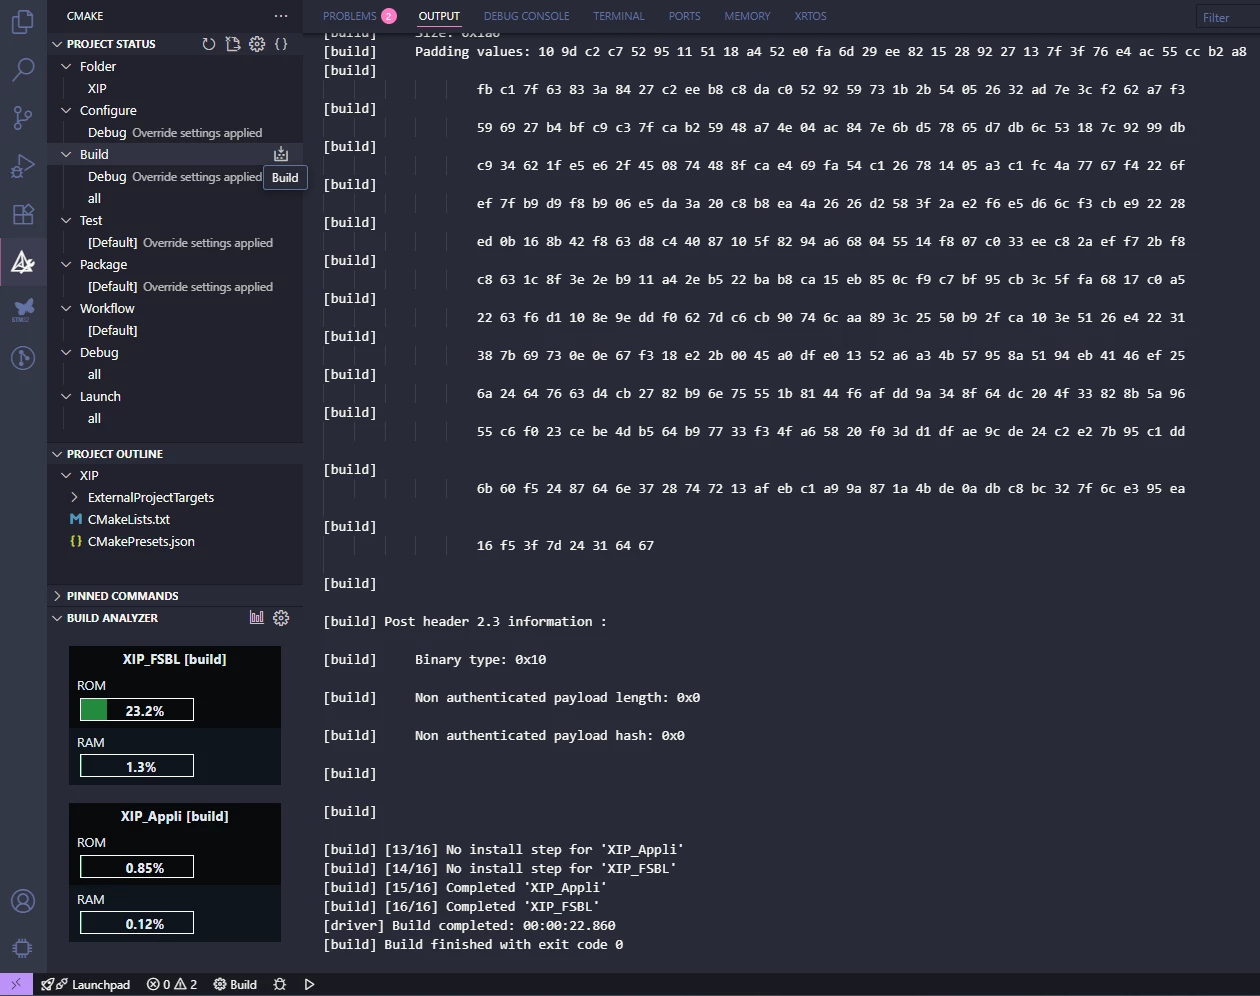
Now that all steps are configured, it is time to build the application, locate the [CMake] icon on the left, then expand the [PROJECT STATUS] to locate the [Build] [All] to rebuild the projects. Alternatively, press Ctrl+Shift+P and then type/click [CMake: Clean Rebuild] for a clean and rebuild action.
6. Create and modify the launch.json file
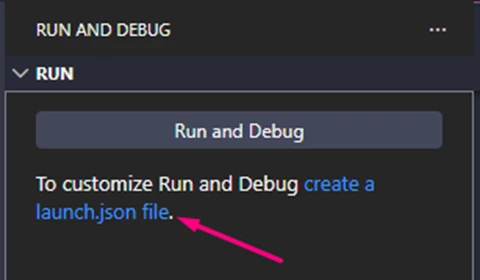
- Open the Run and Debug view (Ctrl+Shift+D).
- Click create a launch.json file.
The current recommended pipeline is to use the Cortex-Debug extension for STM32N6 XIP debug sessions.
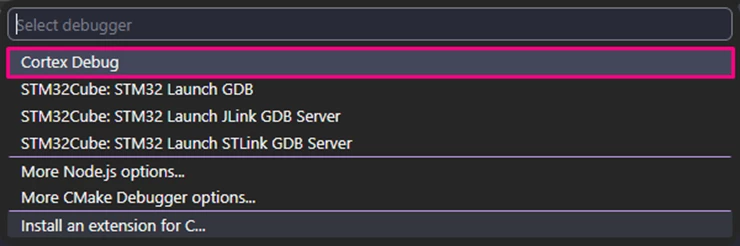
Note: The previous stlinkgdbtarget-based launch configuration is no longer the recommended workflow for this STM32N6 XIP use case.
Edit the generated launch.json to support debugging with all features enabled.
{
    "version": "0.2.0",
    "configurations": [
        {
            "cwd": "${workspaceFolder}",
            "executable": "${workspaceFolder}/FSBL/build/STM32N6_XIP_FSBL.elf", // Replace this with your path and your_FSBL.elf
            "name": "STM32N6-DK / Cortex-Debug",
            "request": "launch",
            "type": "cortex-debug",
            "servertype": "stlink",
            "runToEntryPoint": "BOOT_Application", // Set in BOOT_Application
            "svdPath":"C:/ST/STM32CubeCLT_1.21.0/STMicroelectronics_CMSIS_SVD/STM32N657.svd", // Replace with your .svd path
            //"preLaunchTask": "Flash STM32N6 (DEVBOOT)",
            "serverArgs": [
                "-m",
                "1",
                "-el",
                "C:/Program Files/STMicroelectronics/STM32Cube/STM32CubeProgrammer/bin/ExternalLoader/MX66UW1G45G_STM32N6570-DK.stldr" // Replace with your external loader path
            ],
            "overrideLaunchCommands": [
                "-target-download",
                "monitor halt"
            ],
            "postLaunchCommands": [
                "add-symbol-file C:/Users/%user%/STM32CubeVSCode/Demos/STM32N6_XIP/Appli/build/STM32N6_XIP_Appli.elf" // Replace this with your path and your_Appli.elf
            ]
        }
    ]
}
6.1 Explanation of the launch.json file changes
Changed the debug configuration name:
The "name" field was updated from a generic label to "STM32N6-DK / Cortex-Debug" to clearly identify the target board and make the configuration easier to recognize in the VS Code interface.
Main executable set to the FSBL ELF:
The FSBL is the first valid executable after reset. It is responsible for configuring the external memory interface and enabling memory-mapped mode for the XIP application. For this reason, the debug session must start from the FSBL.
runToEntryPoint set to BOOT_Application:
As explained earlier in this article, breakpoints cannot reliably be placed in application code stored in external memory before the FSBL configures the memory in memory-mapped mode. BOOT_Application is the first safe point after this configuration is completed, so it is used as the initial debugger stop point.
Added svdPath:
A new "svdPath" field was introduced, pointing to the SVD (System View Description) file for the STM32N657 device. This enables the debugger to display peripheral registers and improves the debugging experience by providing detailed hardware information in the UI.
Added serverArgs:
The configuration passes additional arguments to the ST-LINK GDB server:
- “-m”, “1”: This sets the debug server connection mode used in the session.
- “-el”, “external loader path”: This provides the external loader required to access the external flash on the STM32N6570-DK. Without this loader, the debugger cannot correctly access or program the XIP storage device.
Added overrideLaunchCommands:
The launch sequence is customized with:
- -target-download: the FSBL ELF is downloaded to the target
- monitor halt: the target is halted immediately afterward
This ensures that the FSBL ELF is downloaded temporarily for the active debug session and that the target is halted immediately afterward.
This debug download does not replace the trusted images previously programmed into external flash. It is only used to establish the debug session on the FSBL in a controlled and repeatable way.
The trusted images remain necessary because they are the persistent binaries required by the STM32N6570-DK boot flow.
Added postLaunchCommands:
The following command is executed after launch:
- add-symbol-file <Appli ELF path>
This loads the application ELF as an additional symbol file. In resume:
- the FSBL ELF is the main executable used to start the debug session
- the Appli ELF is loaded for symbol resolution only
This gives source-level visibility into the XIP application once execution reaches the application stage, without changing the trusted binaries already programmed into flash.
7. Create and modify tasks.json
Although the debug session uses the FSBL ELF as the main executable and the application ELF for symbols, the trusted signed binaries must still be programmed into the device before debugging.
This is important because the trusted binaries are the images actually required by the STM32N6570-DK secure boot flow and by other boot modes beyond the current debug session.
In this workflow:
- FSBL-trusted.bin and Appli-trusted.bin are flashed into external memory using STM32CubeProgrammer CLI
- these are the persistent trusted images used by the MCU boot flow
- the -target-download command in the debug launch configuration downloads the unsigned FSBL ELF only temporarily for the active debug session
In other words, the debugger download is session-local, while the trusted binaries flashed by the task are the persistent bootable images.
For this reason, the recommended approach is to flash the trusted binaries first using STM32CubeProgrammer CLI, then start the debug session.
Flash using a VS Code task
Create the following .vscode/tasks.json file:
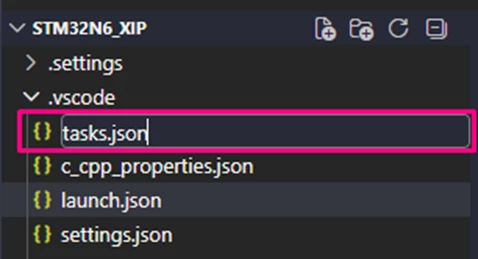
{
    "version": "2.0.0",
    "tasks": [
        // =========================================================================
        // This task invokes the STM32CubeProgrammer CLI to program the board.
        // REQUIREMENT: Board must be in DEVBOOT mode (BOOT1=1) for this to succeed.
        // =========================================================================
        {
            "label": "Flash STM32N6 (DEVBOOT)",
            "type": "process",
            "command": "STM32_Programmer_CLI",

            "args": [
                // CONNECTION: Use SWD port and connect 'Under Reset' (UR)
                "-c", "port=SWD", "mode=UR",

                // EXTERNAL LOADER: Required to program the external memory.
                // Ensure this path points to the correct loader for the STM32N6 DK.
                "-el", "C:/Program Files/STMicroelectronics/STM32Cube/STM32CubeProgrammer/bin/ExternalLoader/MX66UW1G45G_STM32N6570-DK.stldr",

                // FLASHING FSBL (First Stage Boot Loader):
                // Using flat binary (.bin) format requires explicit start address (0x70000000).
                "-d", "${workspaceFolder}/FSBL/build/FSBL-trusted.bin", "0x70000000", "-v", // Verify after write

                // FLASHING APPLI (Main Application):
                // Using flat binary (.bin) format requires explicit start address (0x70100000).
                "-d", "${workspaceFolder}/Appli/build/Appli-trusted.bin", "0x70100000", "-v" // Verify after write
            ],
            "problemMatcher": []
        }
    ]
}
7.1 Explanation of the task
Explicit SWD under-reset connection:
The task uses "-c", "port=SWD", "mode=UR". This selects the SWD debug port and connects under reset, which is more robust for this type of low-level secure/XIP flow.
External loader:
The task specifies “-el”, “external loader path”. This loader is required to program the external memory device used by the STM32N6570-DK board.
Flashing FSBL and Application signed binaries:
The task flashes:
- FSBL-trusted.bin at address 0x70000000
- Appli-trusted.bin at address 0x70100000
The addresses are provided explicitly because the input files are flat .bin images.
This ensures that the binaries are written to the correct locations in external memory.
Running the task
After saving tasks.json, run the task with:
Ctrl+Shift+P → Tasks: Run Task → Flash STM32N6 (DEVBOOT)
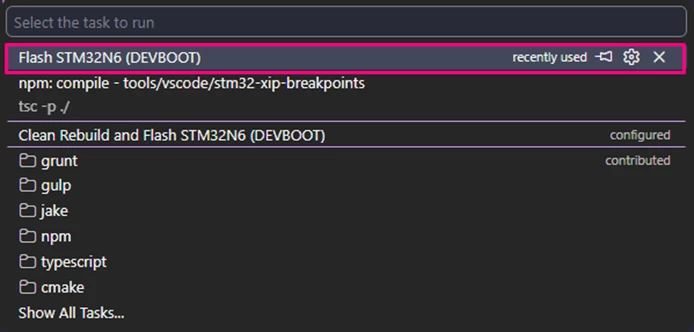
This flashes the signed FSBL and application binaries.
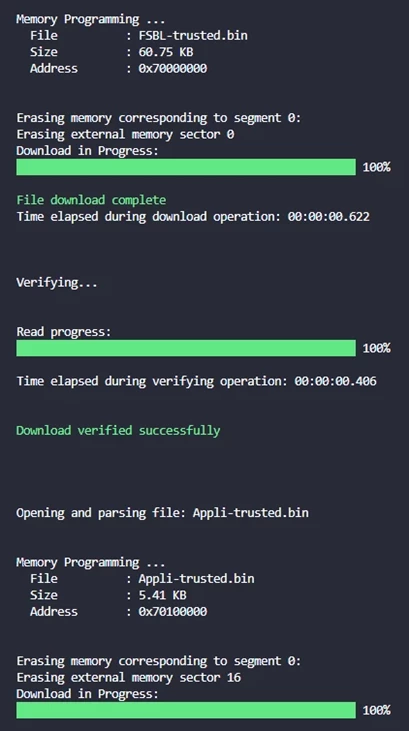
Optional use as a pre-launch task
If desired, the flash task can also be called automatically before starting the debugger by uncommenting the preLaunchTask line in launch.json:
"preLaunchTask": "Flash STM32N6 (DEVBOOT)"
If you prefer to manually control flashing and debugging separately, you can leave preLaunchTask commented out and run the flash task only when needed.
8. Start debugging
- Connect your STM32 board to your PC using the ST-Link debugger.

- In VS Code, select the debug configuration you created.
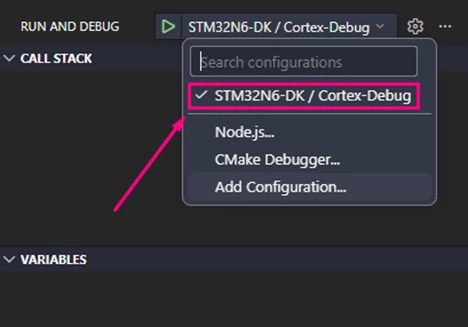
- Press F5 or click the green Start Debugging button.
The debugger starts from the FSBL, loads the application symbols, and automatically runs to:
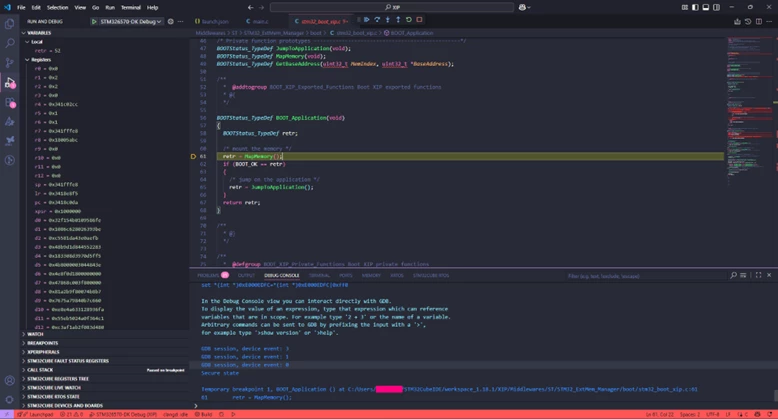
The code starts in the FSBL application running from an address within AXISRAM2. After the code stops here, press [F5] Continue. The green LED should start blinking on the board.
By pausing the code execution, you can confirm that it is running from the external flash by inspecting the function addresses in the call stack. At this stage, all standard debugging features become available, allowing you to:
- Set breakpoints.
- Step through your program.
- Inspect variables, registers, and memory.
- View call stacks.
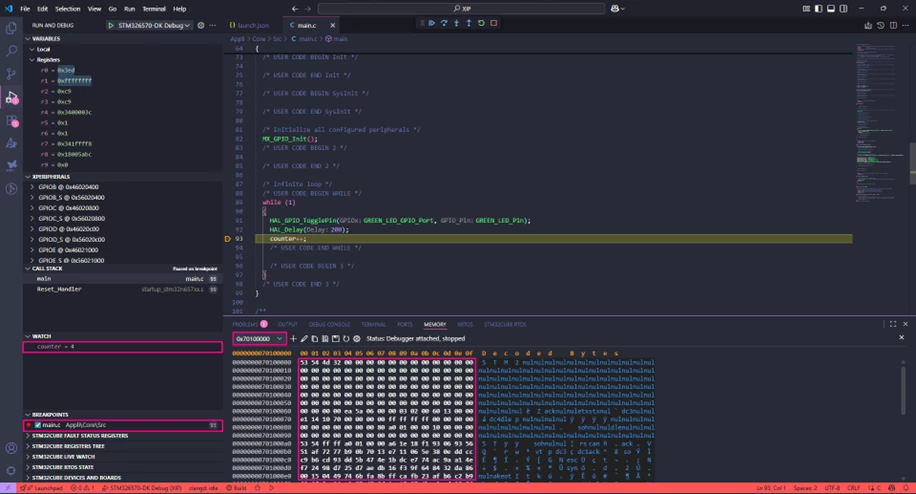
Note: Remember that keeping existing breakpoints between debug sessions can cause failure messages when entering debug mode. If a failure message appears when attempting to enter debug mode, try power cycling the board.
Conclusion
By following these steps, you can successfully debug code running on the STM32N6 using VS Code. This tutorial provides a practical approach, covering environment setup, debugger configuration, and validation to ensure a smooth and effective debugging experience.
Related links
- Knowledge article: How to debug STM32N6 using STM32CubeIDE
- Knowledge article: How to add post build commands in VS Code
- Knowledge article: How to execute code from the external serial NOR using the STM32N6
- Knowledge article: How to debug an external .elf file in VS Code
- User manual 3249: Getting started with STM32CubeN6 for STM32N6 series
- User manual 3234: How to proceed with boot ROM on STM32N6 MCUs
- User manual 3300: Discovery kit with STM32N657X0 MCU
- Reference manual 0486: STM32N647/657xx Arm®-based 32-bit MCUs