
How to manage breakpoints in external memory on STM32N6
Summary
This article explains how to manage breakpoints in external memory when debugging an STM32N6570-DK application that runs in execute-in-place (XIP) mode. In this configuration, the application stored in external flash cannot safely use standard breakpoints until the first-stage bootloader (FSBL) configures the memory in memory-mapped mode. This article presents a practical method to avoid debug startup failures by delaying breakpoint activation until the application region is ready.
Introduction
The article How to debug the STM32N6 using VS Code explains the general procedure to start a debug session on an STM32N6 XIP project. This article focuses on a more specific issue that appears after that setup works: breakpoint management in an application stored in external flash.
In an STM32N6570-DK XIP project, the application does not become safe to debug immediately after reset. The debug session must first pass through the FSBL phase, which prepares the external flash for execute-in-place operation. For this reason, application breakpoints require different handling than in a standard internal flash debug session.
This article shows how to keep application breakpoints between sessions without causing debug startup failures. The method aligns breakpoint behavior with the STM32N6 boot sequence.
Prerequisites
Before proceeding, verify that the base STM32N6 XIP debug flow already works in the setup. This article assumes that the project is already created and configured as described in the related STM32N6 articles, and that the application can be built, signed, flashed, and started correctly.
Have the following items and software installed:
- STM32N6570-DK
- Visual Studio Code
- STM32CubeIDE for VS Code (VS Code Extension)
- Cortex-Debug (VS Code Extension)
- STM32CubeProgrammer
- STM32CubeCLT
- A working STM32N6 project with separate FSBL and Appli images
- Trusted binaries already generated for both images
1. Breakpoint behavior in external memory
In an STM32N6570-DK XIP project, the application is stored in external serial NOR flash. The application becomes safe to execute only after the FSBL configures the external memory interface in memory-mapped mode. Although the debugger can already know the application executable and linking format (ELF) file and its symbols, the application region is not ready for standard breakpoint handling when the session starts.
This condition makes breakpoints in external memory a special case. In a standard debug flow, previously stored breakpoints are often restored as soon as the debugger connects. For applications that run from internal flash, that behavior usually works without issue. In an STM32N6 XIP configuration, however, restoring application breakpoints too early can make the debug session fail. This is because the debugger tries to activate breakpoints in a region that the FSBL has not yet prepared.
This behavior is usually observed as follows:
- The debug session fails at startup.
- The failure often occurs if application breakpoints remain from a previous session.
- Removing those breakpoints usually allows the session to start normally again.
- After execution reaches BOOT_Application, breakpoints in the application can be used normally.
The root cause is not symbol visibility, but the timing of breakpoint activation relative to the STM32N6 boot sequence. At startup, the FSBL is the only valid debug context. The application symbols can already be available on the host side, but application breakpoints must become active only after the external flash is configured in memory-mapped mode.
For this reason, the recommended strategy is to align breakpoint handling with the device boot flow:
- Start the debug session from the FSBL.
- Load the application ELF only as a symbol file.
- Temporarily disable user breakpoints at the beginning of the session.
- Use BOOT_Application as the first safe trigger point.
- Re-enable application breakpoints only after that point is reached.
This method keeps the debug session consistent with the STM32N6 XIP startup sequence and avoids common breakpoint-related startup failures.
2. Example debug configuration
The complete STM32N6 XIP debug setup is already covered in the article How to debug the STM32N6 using VS Code. This section does not repeat the full configuration process. It shows the launch.json version used for the breakpoint management method described in this article.
In this flow, the debug session still starts from the FSBL, as in the base STM32N6 XIP setup, but the postlaunch stage is handled differently so that breakpoint activation can be controlled safely for the application that runs from external memory.
The launch.json file used in this example is shown below.
{
    "version": "0.2.0",
    "configurations": [
        {
            "cwd": "${workspaceFolder}",
            "executable": "${workspaceFolder}/FSBL/build/STM32N6_XIP_FSBL.elf", // Replace this with your path and your_FSBL.elf
            "name": "STM32N6-DK / Cortex-Debug",
            "request": "launch",
            "type": "cortex-debug",
            "servertype": "stlink",
            "svdPath":"C:/ST/STM32CubeCLT_1.21.0/STMicroelectronics_CMSIS_SVD/STM32N657.svd", // Replace with your .svd path
            "preLaunchTask": "Flash STM32N6 (DEVBOOT)",
            "serverArgs": [
                "-m",
                "1",
                "-el",
                "C:/Program Files/STMicroelectronics/STM32Cube/STM32CubeProgrammer/bin/ExternalLoader/MX66UW1G45G_STM32N6570-DK.stldr" // Replace with your external loader path
            ],
            "overrideLaunchCommands": [
                "-target-download",
                "monitor halt"
            ],
            "postLaunchCommands": [
                "source C:/Users/%user%/STM32CubeVSCode/Demos/STM32N6_XIP/.vscode/xip_boot.gdb" // Replace this with your path to the .gdb script
            ]
        }
    ]
}
Compared with the base STM32N6 XIP debug setup, the important difference is that the postlaunch phase now sources a dedicated GNU Debugger (GDB) script. This script controls when the application symbols are loaded and when the user breakpoints are re-enabled, so that the application in external memory is debugged only after the FSBL completes the memory-mapping step.
For a project-specific configuration, adjust the following paths:
- FSBL ELF path
- SVD file path
- External loader path
- xip_boot.gdb path
The rest of the configuration can remain aligned with the working STM32N6 XIP debug flow from the reference article.
3. Create the GDB script
The next step is to create the GDB script used by “postLaunchCommands”. This script is the key element of the breakpoint-management method, because it changes when the application breakpoints become active.
Create the following file in your workspace:
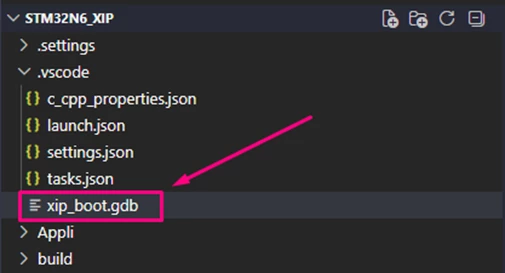
Then add the following content:
# .vscode/xip_boot.gdb
# Prevent GDB from asking "Are you sure? (y/n)" when loading symbols
set confirm off
# 1. Safety first: force hardware breakpoints
set mem inaccessible-by-default off
set breakpoint auto-hw on
# 2. DISABLE all user breakpoints that VSCode just sent
disable
# 3. Load the Application symbols
add-symbol-file C:/Users/%user%/STM32CubeVSCode/Demos/STM32N6_XIP/Appli/build/STM32N6_XIP_Appli.elf
# 4. Set our own manual trigger at the jump point
thb BOOT_Application
# 5. Tell GDB what to do when it hits BOOT_Application
commands
enable
end
# 6. Start the FSBL boot sequence
Continue
This script runs immediately after the debug launch sequence. Its purpose is to keep the debug session safe during the early boot phase, when the external memory is not ready for standard application breakpoint handling.
The behavior is as follows:
- It disables the user breakpoints that the debugger already restored.
- It loads the application ELF as a symbol file.
- It sets a temporary hardware breakpoint at BOOT_Application.
- When that point is reached, it re-enables the user breakpoints.
- The application can then be debugged normally.
For your own project, the part that usually needs to be changed is the path passed to add-symbol-file, so that it points to your application ELF.
The important point is that the script does not remove application debugging. It only delays breakpoint activation until the FSBL has already configured the external flash in memory-mapped mode.
4. Use the existing flashing task
The trusted binaries must still be programmed into external flash before the debug session starts. Since this article assumes that the base STM32N6 XIP workflow is already working, there is no need to create a new flashing method here. The same task used in the reference debug article can continue to be used.
In the configuration shown previously, this is done through:
"preLaunchTask": "Flash STM32N6 (DEVBOOT)"
This means that before the debugger starts, VS Code runs the task that flashes the following files into external flash at their expected addresses:
-
FSBL-trusted.bin
-
Appli-trusted.bin
This step remains important even though the debug session later performs a temporary download of the FSBL ELF. The temporary -target-download command exists only for the active debug session, while the trusted binaries are the persistent bootable images that the STM32N6 boot flow requires.
5. Debug workflow
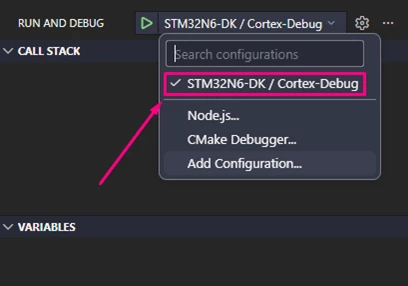
Once the launch.json configuration has been updated and the GDB script is in place, the debug session can be started normally from VS Code.
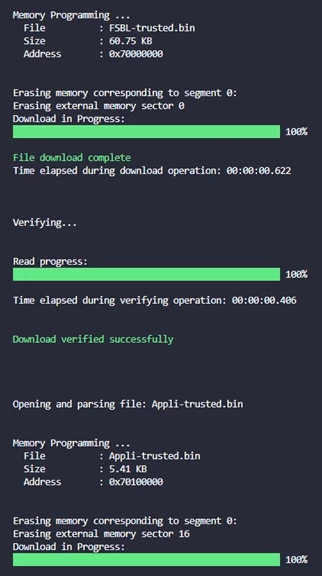
At the beginning of the session, the trusted binaries are flashed through the existing prelaunch task, and the FSBL ELF is downloaded temporarily for the active debug session.
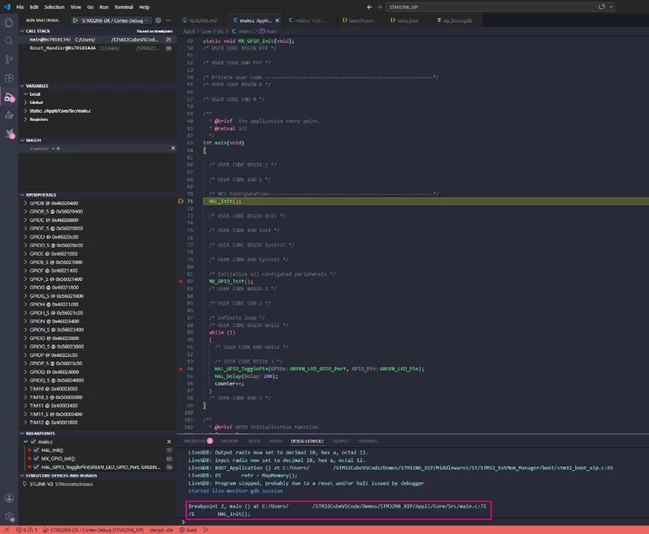
After that, the GDB script takes control of the early boot phase. The script first disables the user breakpoints that were already present before entering debug mode. It then places a temporary breakpoint at BOOT_Application and lets the FSBL continue running. When execution reaches that point, the external flash has already been configured in memory-mapped mode, so the script can safely re-enable the user breakpoints.
From the user point of view, the workflow is simple:
- Start the debug session as usual
- Let the FSBL execute until the temporary stop at BOOT_Application
- Continue debugging normally from that point onward
A practical advantage of this method is that you can keep your breakpoints in the external-memory application between sessions. They do not need to be removed manually before starting the debugger, because the GDB script temporarily disables them during the early boot phase and restores them only after the system reaches a safe point.
Conclusion
Managing breakpoints in an STM32N6570-DK XIP project requires the debug flow to follow the real boot sequence of the device. The application stored in external flash is not ready for normal breakpoint usage when the session begins, so the key is not to avoid breakpoints, but to delay their activation until the FSBL has completed the memory-mapping step.
By using the FSBL as the main debug entry point and replacing the normal postlaunch behavior with a dedicated GDB script, the session can start reliably. This applies even when breakpoints already exist in the external-memory application. The breakpoints remain part of the normal development workflow, but they only become active once execution reaches BOOT_Application, which is the first safe point for the XIP application.
This approach provides a practical and repeatable way to debug external-memory applications on the STM32N6570-DK without having to remove breakpoints before every new session.
Related links
- Knowledge article: How to debug STM32N6 using STM32CubeIDE
- Knowledge article: How to add post build commands in VS Code
- Knowledge article: How to execute code from the external serial NOR using the STM32N6
- Knowledge article: How to debug an external .elf file in VS Code
- User manual UM3249: Getting started with STM32CubeN6 for STM32N6 series
- User manual UM3234: How to proceed with boot ROM on STM32N6 MCUs
- User manual UM3300: Discovery kit with STM32N657X0 MCU
- Reference manual RM0486: STM32N6x5/x7xx Arm®-based 32-bit MCUs