- STMicroelectronics Community
- STM32 MCUs Software development tools
- STM32CubeIDE (MCUs)
- GDB commands (echo, printf) in Debug Configuration...
- Subscribe to RSS Feed
- Mark Topic as New
- Mark Topic as Read
- Float this Topic for Current User
- Bookmark
- Subscribe
- Mute
- Printer Friendly Page
GDB commands (echo, printf) in Debug Configurations' Run Commands?
- Mark as New
- Bookmark
- Subscribe
- Mute
- Subscribe to RSS Feed
- Permalink
- Email to a Friend
- Report Inappropriate Content
2021-04-24 1:24 AM
I am following https://github.com/ethanhuanginst/STM32CubeIDE-Workshop-2019/tree/master/hands-on/09_BOOT-APP ; most everything there works for my Nucleo board, too.
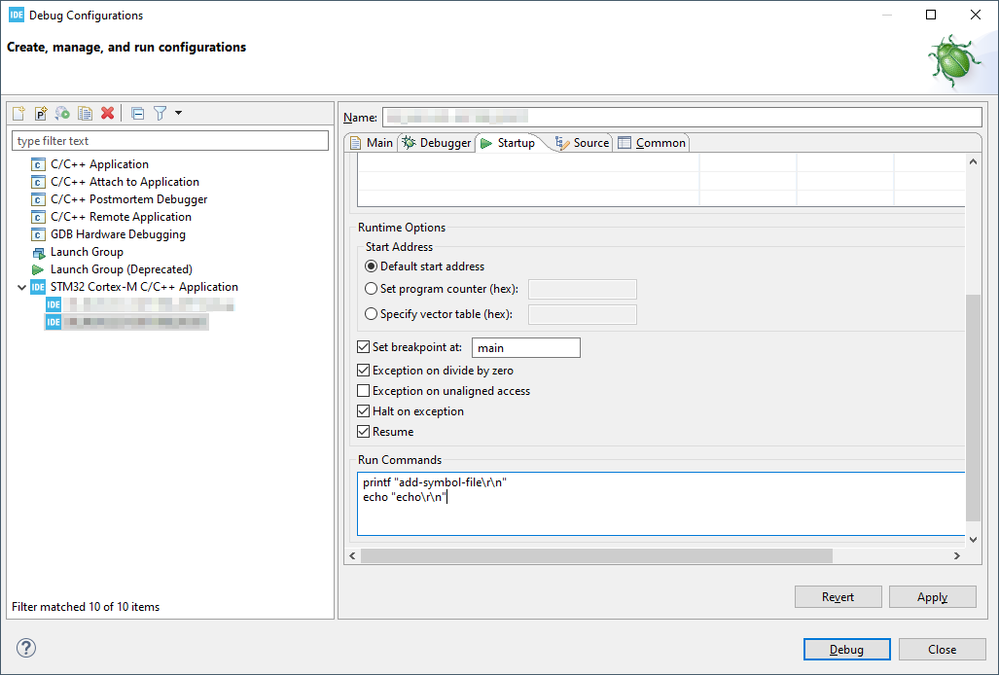
However, I can see gdb is used, and in particular, a gdb script (as indicated by add-symbol-file) is used in Debug Configurations' Run Commands. Since in gdb command scripting there are both echo and printf commands, I thought I should try it in Debug Configurations > Startup tab > Run Commands -- say, the following:
printf "add-symbol-file\r\n"
echo "echo\r\n"
It turns out, that these commands end up in the .launch file of the project:
$ grep -r echo stm32_project_dir/
stm32_project_dir/PROJECTNAME.launch: <stringAttribute key="org.eclipse.cdt.debug.gdbjtag.core.runCommands" value="printf "add-symbol-file\r\n" echo "echo\r\n""/>
...That leads me to my first question:
- When following the above workshop page and reconstructing the projects there, for me, the APP project resulted with a "(PROJECTNAME) Debug.launch" file, and the BOOT project with just a "(PROJECTNAME).launch" file. What causes this difference in the naming of the autogenerated .launch files?
However, when I click Run > Debug, and I finally get a connection to the debugger, I cannot see these printouts anywhere -- at least not in the Debugger Console, where I'd have expected they would appear:

- Is it possible to use gdb commands like echo and printf in the gdb script in Debug Configurations' Run Commands -- and if so, how? (is there some additional setup; is the Debugger Console the right place to look for these output printouts?)
- Labels:
-
STM32CubeIDE
- Mark as New
- Bookmark
- Subscribe
- Mute
- Subscribe to RSS Feed
- Permalink
- Email to a Friend
- Report Inappropriate Content
2021-04-26 9:11 AM
Ok, seems I got somewhere; first, I found this post that refreshed my memory:
https://stackoverflow.com/questions/37530271/how-to-include-gdb-commands-in-logging-file
... so I thought, why not try explicitly enabling gdb logging, and see what happens?
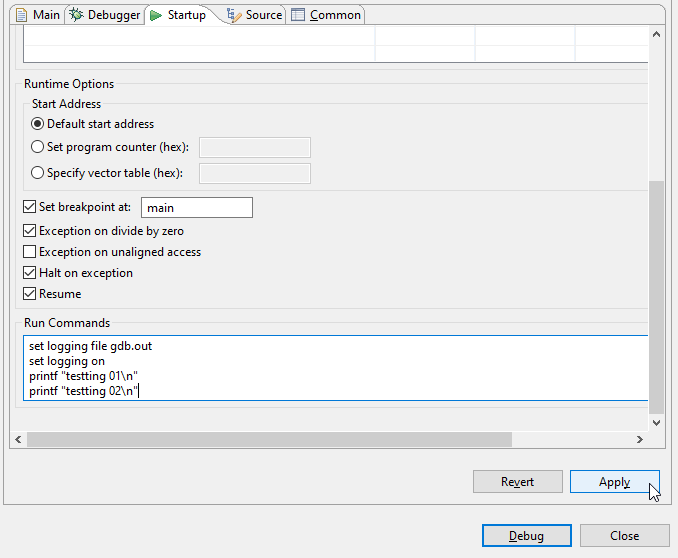
So, I entered the below script in Debug Configurations - Run Commands:

set logging file gdb.out
set logging on
printf "testting 01\n"
printf "testting 02\n"
Upon starting a debug session, there are still no messages in the Debugger Console - however, I do get a `gdb.out` file, with contents like below;
44^done
(gdb)
&"printf \"testting 01\\n\"\n"
~"testting 01\n"
45^done
(gdb)
&"printf \"testting 02\\n\"\n"
~"testting 02\n"
46^done
(gdb)
47^running
*running,thread-id="1"
~"Note: automatically using hardware breakpoints for read-only addresses.\n"
(gdb)
&"\n"
^done
(gdb)
48^done,new-thread-id="1"
(gdb)
=breakpoint-modified,bkpt={number="1",type="breakpoint",disp="keep",enabled="y",addr="0x08000620",func= ...
So, apparently that channel which is used for default logging in "vanilla" gdb, here is used to communicate with the GDB server...
This is also possibly related, even if for Visual Studio: https://stackoverflow.com/questions/37440163/output-of-remote-gdb-debugger-in-visual-studio
Still - good to know I have a way to check out debugger messages of gdb's debug session in STM32CubeIDE.
-------------------
EDIT: Did a bit of more research into this:
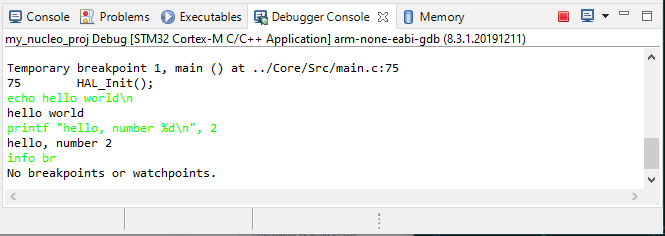
1.It was not quite obvious to me, but you can type in the Debugger Console, once the debugger is halted on a breakpoint; here echo and printf work just fine (however, then you are in the gdb client, so to speak):

2.Actually, even if a plain old gdb command like `info br`, which runs fine when typed in Debug Console, it will print nothing in Debug Console, when saved in "Initialization Commands" or "Run Commands" of Debug Configurations of the debugged project.
3.I saw in https://community.st.com/s/question/0D50X0000Bh8tmx/how-to-erase-flash-before-programming-with-stm32cubeide-solved the use of a `monitor flash mass_erase` command in "Initialization Commands" and it worked for me; and I realized the monitor command is used for talking to a remote gdbserver after finding https://sourceware.org/gdb/current/onlinedocs/gdb/Server.html :
> 20.3.3 Monitor Commands for gdbserver
> During a GDB session using gdbserver, you can use the monitor command to send special requests to gdbserver
However, of the example commands listed there, `monitor help` typed in Debugger Console returns nothing; `help monitor` returns "Send a command to the remote monitor (remote targets only)." - and all others like "monitor set debug 1", "monitor set remote-debug 1", "monitor echo words", all raise errors like:
Error message from debugger back end:
Protocol error with Rcmd
Failed to execute MI command:
monitor echo words
There is a whole list of stuff if you type "help set remote" in the debugger console, not sure if it is related.
4.There seems to be some sort of a bash shell access in the Debugger Console, e.g.:
shell bash -c "echo Hello from Init Commands > mygdb.out"... will execute just fine in "Initialization commands" or "Run commands", and will create a mygdb.out file in the project's Debug directory; works also in the Debugger Console, when halted on a breakpoint and you can type commands. Also:
shell bash -c "echo Hello shell 1>&2"... will work if typed in Debugger Console - you should see text in red, which most likely means we printed to stderr, as intended. If you add this to "Run Commands", no error will be raised, but no text will be printed in the Debug Console.
------
EDIT2: Found the documentation finally: https://www.st.com/resource/en/user_manual/dm00613038-stm32cubeide-stlink-gdb-server-stmicroelectronics.pdf ... However, it says that "monitor help" should print some help text - but in my case it doesn't?
- Mark as New
- Bookmark
- Subscribe
- Mute
- Subscribe to RSS Feed
- Permalink
- Email to a Friend
- Report Inappropriate Content
2021-04-30 3:20 AM
Hi @sdbbs ,
monitor help should return some helpful info, but apparently does not work. Will create a bug report. "monitor help" does seem to work if the user launches the GDB-client externally. Quite low prio since the commands are documented in the manuals you refer to.
About "Run commands" and printing to "Debugger console". This is not possible. Because CubeIDE opens two channels to the GDB-client.
- The "Debugger console" has its own pipe/channel to the GDB-client to allow interaction with target.
- All other CubeIDE communication with the target under debug is managed via MI (machine interface). For example "Run commands" when launching debug, or when you click step/halt/... So to see your echo output from the "Run Commands" you can enable the GDB traces. Window > Preferences > C/C++ > Debug > GDB > checkbox "...show GDB traces..."
Hope it clarifies part of the mystery.
- Mark as New
- Bookmark
- Subscribe
- Mute
- Subscribe to RSS Feed
- Permalink
- Email to a Friend
- Report Inappropriate Content
2021-05-03 8:49 AM
Many thanks for your answer, @mattias norlander - that was a very helpful explanation!
I would just like to confirm:
> About "Run commands" and printing to "Debugger console". This is not possible. [...]
... I'm OK with that, given the explanation - but then I see:
> So to see your echo output from the "Run Commands"
... so I wonder, do you mean that I should be able to see a "proper" output from `echo` or `printf` in Debugger Console, -- or should I be able to see some sort of a log, like the `gdb,out` above, for any command in the script, also in the Debugger Console? Or should I look elsewhere, not in the Debugger Console?
I tried to enable the checkbox "...show GDB traces..." - but I could see no change whatsoever (STM32CubeIDE Version: 1.6.1, Build: 9958_20210326_1446 (UTC) on Windows 10 Home).
On the other hand, I also tried to check "use external console for inferior (open a new console window for input/output)", and I couldn't see any obvious change either (no new console window was opened); as if the C/C++ > Debug preferences are fully ignored for me.
But even if I keep these two unchecked, and go back to Debug Configurations > Debugger > probe: ST-LINK (ST-LINK GDB server) > check Log to file:, Apply and Debug - then I do get some printouts in GUI upon clicks on Resume or Suspend - but in the Console (not the Debugger Console).
So if you (or anyone) has some other suggestions to try so I can see some GDB printouts in the GUI, I'd love to hear that! Otherwise I'm OK also with logging to file.
- How to open .ioc file from Windows command line? in STM32CubeMX (MCUs)
- STM32L4R9 factory programming in STM32CubeProgrammer (MCUs)
- Build outputs and presets in VS Code in STM32CubeIDE for Visual Studio Code (MCUs)
- Project converter fails to make valid json from my pre-build step command in STM32CubeIDE for Visual Studio Code (MCUs)
- What's the Recommended CLI Environment Variable Path after VS Code Integration? in STM32CubeIDE for Visual Studio Code (MCUs)