- STMicroelectronics Community
- Knowledge base
- STM32 MCUs
- How can I add TraceX support in STM32CubeIDE?
- Subscribe to RSS Feed
- Mark as New
- Mark as Read
- Bookmark
- Subscribe
- Email to a Friend
- Printer Friendly Page
- Report Inappropriate Content
How can I add TraceX support in STM32CubeIDE?
- Subscribe to RSS Feed
- Mark as New
- Mark as Read
- Bookmark
- Subscribe
- Email to a Friend
- Printer Friendly Page
- Report Inappropriate Content
on 2021-09-30 9:43 AM
How can I add TraceX support in STM32CubeIDE?
To add TraceX support to a STM32CubeIDE project and properly use it you’ll need to follow a few steps, described in detail in this article.
Goal: Add TraceX support to STM32CubeIDE using X-CUBE-AZRTOS-H7Although the example is using the NUCLEO-H723ZG, you can use the same steps for other STM32H7 based boards. The main differences are usually pinout and clock configuration.
This article will show you how to add TraceX support in a simple project that already uses ThreadX with the X-CUBE-AZRTOS-H7 software package.
TraceX allows a post mortem analysis of the thread sequence that occurred during firmware execution; here is a simplified block diagram flow:

-
Prerequisites:
- Install TraceX using Microsoft’s Store
- Install STM32CubeIDE and software package
- Have a working ThreadX project in STM32CubeIDE that uses the software package X-CUBE-AZRTOS-H7 or similar
- You can refer to this article on how to create one from scratch: https://community.st.com/s/article/how-to-create-a-thread-using-azurertos-and-stm32cubeide
-
How to make it work:
-
Activate the feature in the firmware

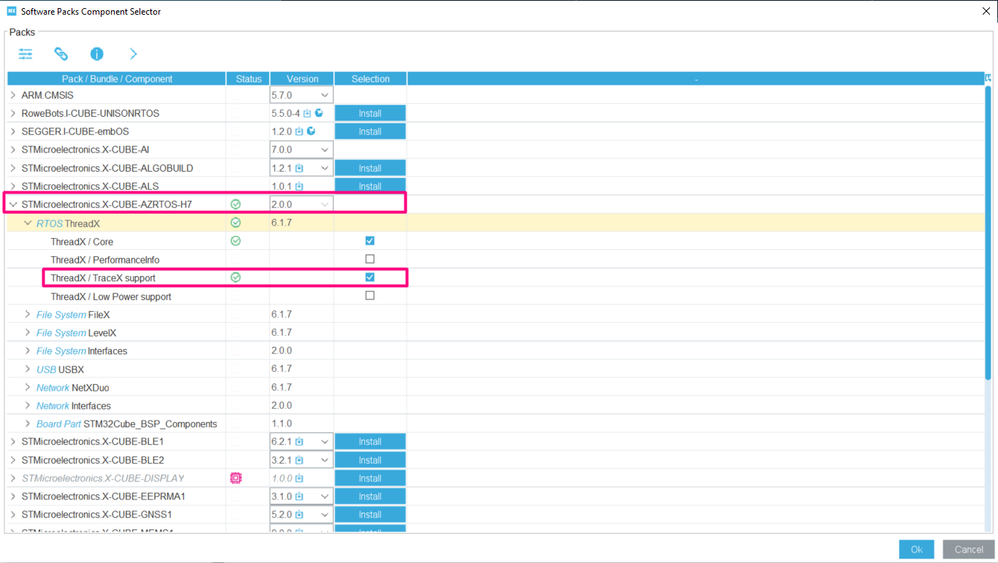
Enable ThreadX / TraceX support feature in the software packs component selector:
-
Allocate the memory to store the trace during firmware execution

The trace timestamp source is setup by default on the cycle counter of the Cortex at address 0xE0001004.
Go to Project->Generate Code to update the generated code for TraceX support or use the ALT+K keyboard shortcut.

-
Add small pieces of code to provide the memory allocation dedicated to trace
#define TRACEX_BUFFER_SIZE 64000
uint8_t tracex_buffer[64000];
Inside the function App_ThreadX_Init we enable the trace:
tx_trace_enable(&tracex_buffer,TRACEX_BUFFER_SIZE,30);
The code should look like this:

Add the trace buffer to AXI SRAM. In order to do this, open the STM32H723ZGTX_FLASH.ld file and add this code:
.trace (NOLOAD):
{
. = ALIGN(4);
*(.trace)
} > RAM_D1
It should look like this:

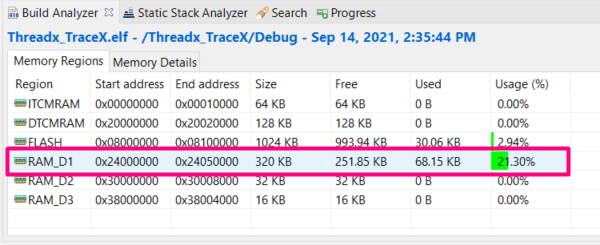
Now the trace buffer will be in the known location 0x24000000 (RAM_D1). Upon building, you should be able to see the RAM_D1 now being used in the Build Analyzer, located at the lower right corner of the STM32CubeIDE:

Locate and open the File Association Section then clock in the "add" icon to create the *.trx file type support. Once applied, click in the second "add" button and the select the TraceX software:
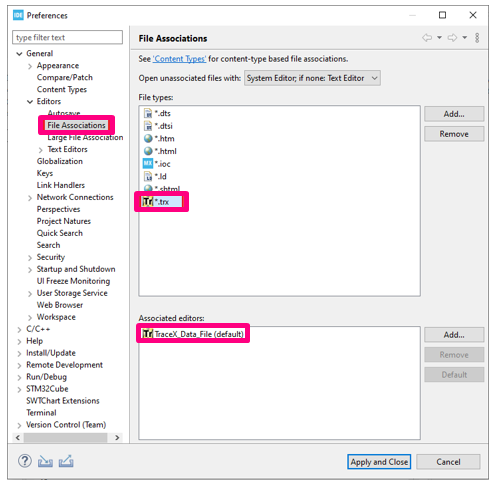
To complete this step, click in the "Apply and Close"

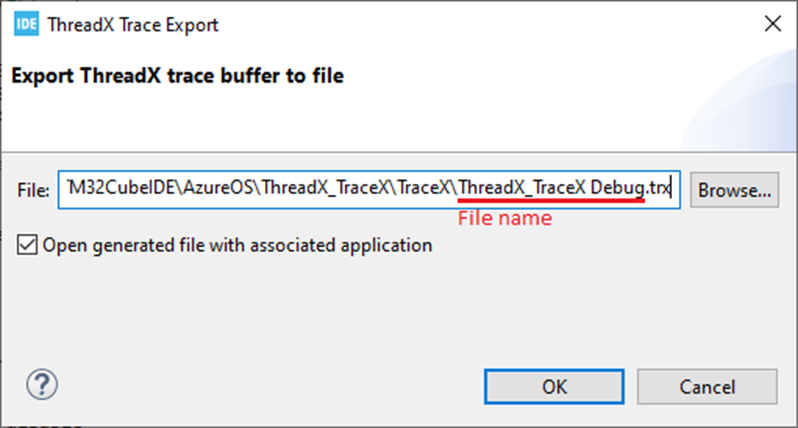
In the opened tab, click on the Export Trace option.

Another menu will appear, where you'll be able to change the file path/name and also select if you want to open the TraceX with the generated file.

-
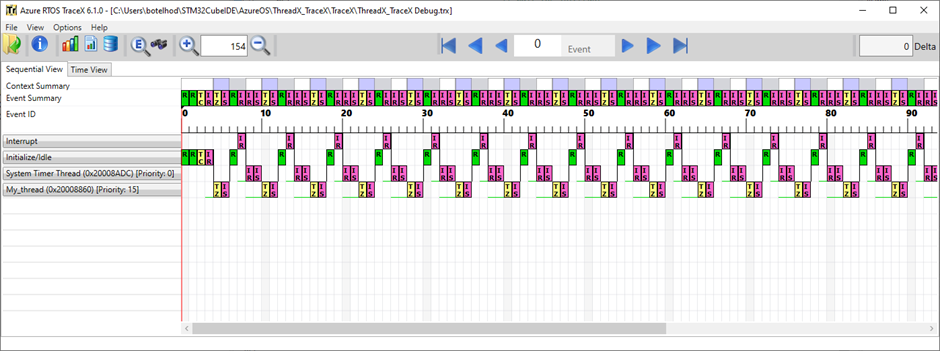
As an alternative, you can keep using Microsoft’s TraceX tool to display the result as well

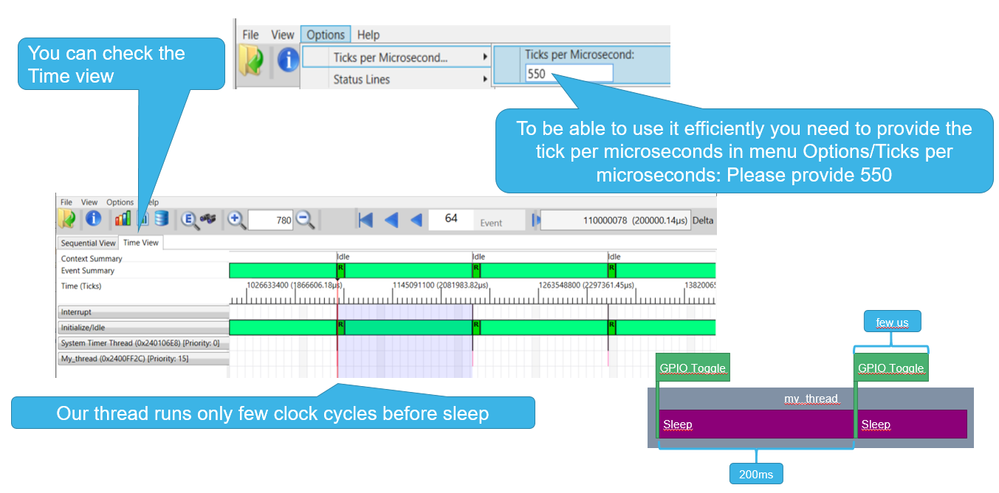
Now all the information is available for analyzes – as the code used had a single thread that was used to blink the LED every 200ms, the overall view is quite simple, but this is the overall analysis:

The TraceX also allows using time view:
-
Useful links:
- STM32CubeIDE: https://www.st.com/en/development-tools/stm32cubeide.html
- NUCLEO-H723ZG: https://www.st.com/en/evaluation-tools/nucleo-h723zg.html
- ThreadX user guide https://docs.microsoft.com/en-us/azure/rtos/threadx/about-this-guide
- ThreadX api description https://docs.microsoft.com/en-us/azure/rtos/threadx/chapter4
- ThreadX cheatsheet https://rristm.github.io/stm32_threadx
- Github: https://github.com/STMicroelectronics/x-cube-azrtos-h7
- TraceX user guide: https://docs.microsoft.com/en-us/azure/rtos/tracex/
-
Conclusion:
-
- Adding the ThreadX component in STM32CubeMX/STM32CubeIDE
- Add TraceX support and apply minor configuration in STM32CubeMX/ STM32CubeIDE
- Generate the code from STM32CubeMX/ STM32CubeIDE
- This will update the project structure with all needed files
- Create the size of the buffer that will store the trace during firmware execution
- Export this data to be analyzed on TraceX
- Have fun :)
- Mark as Read
- Mark as New
- Bookmark
- Permalink
- Email to a Friend
- Report Inappropriate Content
This works perfectly if I use only ThreadX module, but when I tried to use TraceX in the application where ThreadX and USBx are used I receive always a "Precise data access violation" hard fault. As I figured out, it happens when USBx thread (registered in a separate byte pool than ThreadX threads) tries to register a traceX object (in _ux_trace_object_register function).
Can you, pls, give an example of how to set up a TraceX functionality for ThreadX used with USBx as well as other Azure modules?
p.s. I have tried this on Nucleo-L552.
- Mark as Read
- Mark as New
- Bookmark
- Permalink
- Email to a Friend
- Report Inappropriate Content
Hello @QDot ,
Thank you for your feedback, we are working on an article covering TraceX and USBX and ThreadX that would be of interest for you.