- STMicroelectronics Community
- STM32 MCUs
- STM32 MCUs Products
- STM32F4 ETM Trace configuration problem
- Subscribe to RSS Feed
- Mark Topic as New
- Mark Topic as Read
- Float this Topic for Current User
- Bookmark
- Subscribe
- Mute
- Printer Friendly Page
STM32F4 ETM Trace configuration problem
- Mark as New
- Bookmark
- Subscribe
- Mute
- Subscribe to RSS Feed
- Permalink
- Email to a Friend
- Report Inappropriate Content
2017-03-13 3:40 AM
Hi,
I'm using ULINKpro and Keil uVision 5.23.0.0 as debugger.
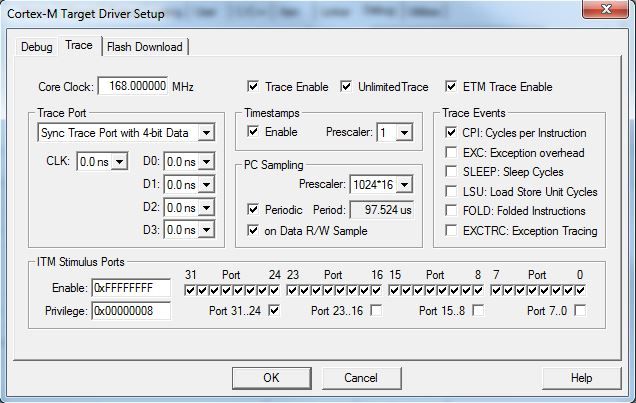
I can't make ETM Trace (sync mode, 4-bit data) works properly on a STM32F427ZG with a core clock of 168MHz.
I tried to lower the core clock working frequency to 42MHz, and that made Trace starts working. It's a problem of too high frequency?
Before this one, I tried to configure Trace on a STM32F407ZG, on the same board (pin-to-pin compatible) and with the same software (except for small mandatory fixes due to the different microcontroller). S
trangely
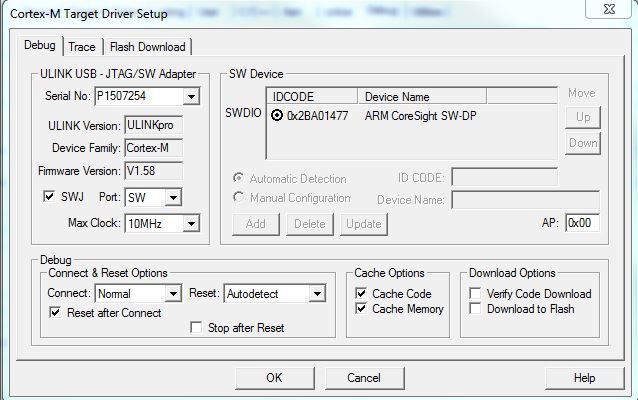
enough, this one works also at 168MHz, with the same Trace configuration!Here is the configuration screen:


This is the initialization file:
FUNC void DebugSetup (void) {
// Enable trace port and clock signals
_WDWORD(0x40023830, _RDWORD(0x40023830) | 0x00000010); // RCC_AHB1ENR: IO port E clock enable _WDWORD(0x40021000, 0x00002AA0); // GPIOE_MODER: PE2..PE6 = Alternate function mode _WDWORD(0x40021008, 0x00003FF0); // GPIOE_OSPEEDR: PE2..PE6 = 100 MHz speed _WDWORD(0x4002100C, 0x00000000); // GPIOE_PUPDR: PE2..PE6 = No Pull-up/Pull-down _WDWORD(0x40021020, 0x00000000); // GPIOE_AFRL: PE2..PE6 = AF0 _WDWORD(0xE0042004, 0x000000E0); // DBGMCU_CR: TRACE DATA enabled Size 4 _WDWORD(0xE0042008, 0x00001000); // DBGMCU_APB1_FZ: the independent watchdog counter clock is stopped when the core is halted}SAVE CalibValue.hex 0x8004000, 0x08010000 // save device data
LOAD CalibValue.hex INCREMENTAL; // load device data before reprogramming
/*-------------------------------------------------------------------
** Invoke the function at debugger startup**-----------------------------------------------------------------*/DebugSetup(); // Debugger Setup/*-------------------------------------------------------------------
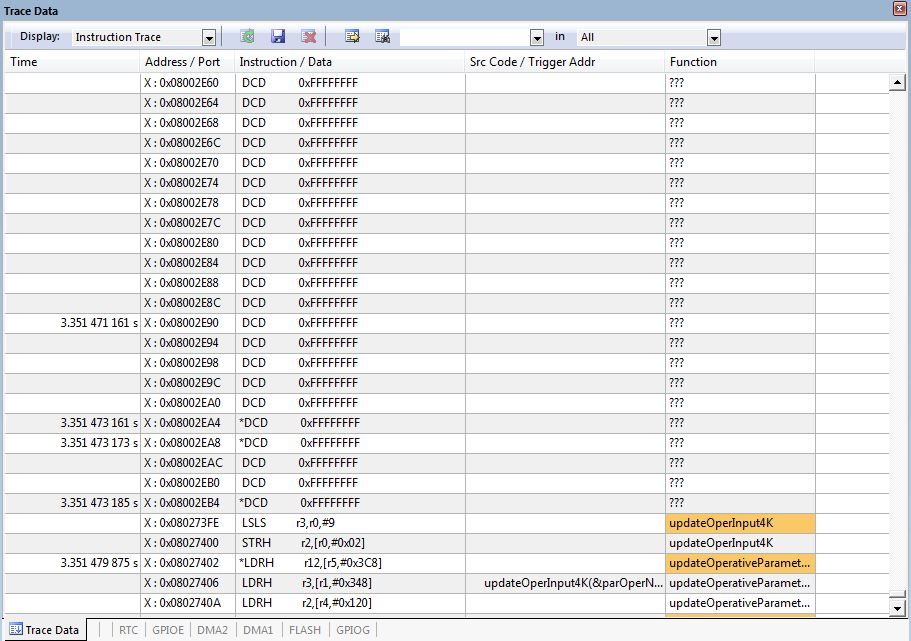
** Execute upon software RESET**-----------------------------------------------------------------*/FUNC void OnResetExec(void) { DebugSetup();}When I run the debug, Trace status is ''Data stream error''. When I stop the execution, there is an attempt to process the captured data, and after an
anomalous
long time I get something like this:
Best regards.
- Mark as New
- Bookmark
- Subscribe
- Mute
- Subscribe to RSS Feed
- Permalink
- Email to a Friend
- Report Inappropriate Content
2017-06-18 12:23 PM
Hello
Generally, ETM will work to only approximately 100 MHz...maybe a little higher..
This depends on several things: the chip itself, drive characteristics of the 5 ETM output bits, the clock frequency and the board layout (especially TRC_CLK).
Since only program change frames are sent out the ETM port, more branches in your program might cause this 4 bit port to become overloaded.
You can try and run the CPU clock over 100 MHz to see how far your particular system can run at.
Please see the attached document on pages 30 - 40 for ETM info. This is on the Cortex-M7 but is applicable for the STM32F4 processors.
It describes how to lower the CPU frequency to 100 MHz.
Note that recently the .ini file used for configuring ETM ports and or SWO might/can be provided in the Software Pack.
If you know where the Trace tab is in uVision, in some newer Packs there is an extra tab called Pack. You can enable/disable the initialization and see the contents of this new .dbgconf file.
The ini file that usually comes with uVision is slightly different than the one shown above. Look for an example from Keil Software Packs called Blinky_Ulp.
Note: The Core Clock: frequency does not need to be correct to get valid ETM trace frames. However, uVision uses this value to calculate timing values displayed in some windows.
Bob Boys
ARM/Keil
________________ Attachments : Discovery_M7.pdf : https://st--c.eu10.content.force.com/sfc/dist/version/download/?oid=00Db0000000YtG6&ids=0680X000006Hyc5&d=%2Fa%2F0X0000000bA8%2FX03vGNDniPIBEComwzAXeNv4o_xlQUJ8Gtrp445BMvo&asPdf=false- Mark as New
- Bookmark
- Subscribe
- Mute
- Subscribe to RSS Feed
- Permalink
- Email to a Friend
- Report Inappropriate Content
2018-04-20 5:09 AM
Greetings
I've recently had a similar issues with the STM32F777II processor. I've compared it to the STM32F407 that is on the MCSB reference boards. Ended up having to add a 2.6ns delay on the Clock signal. Now the STM32F777II emits trace data at up to 216MHZ, and mostly synchronises well with the Keil uLinkPro in Keil MDK.
I had no issue with the Segger J-Trace in Ozone. It worked flawlessly at full speed without having to do anything.
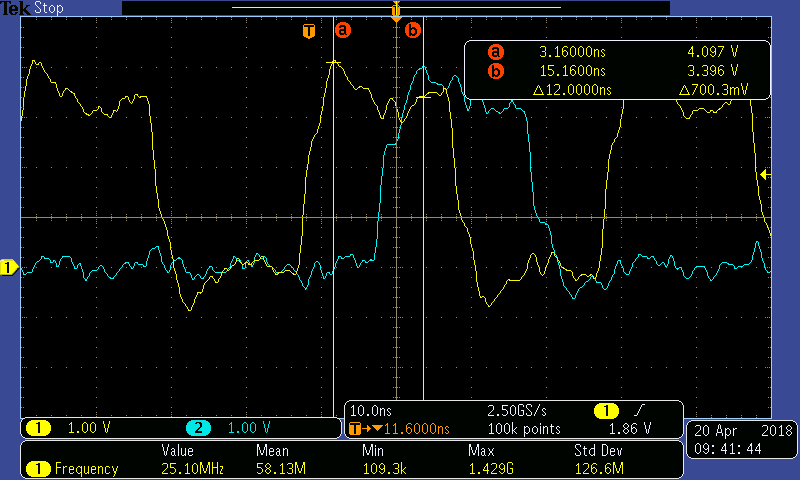
I ended up scoping the CLK and TRACE_0 lines on a 300MHz scope with 500MHz probes. The behaviour is...odd. From the ETM timing specifications one would expect the clock to be delayed resulting in about a 90 degree phase shift between clock and data. However, tests show that the clock actually seems to precede the TRACE_0 data.

The yellow trace is the CLK signal, cyan is the TRACE_0 data signal. CPU frequency was 50MHz.
Unless the actual sampling occurs on the falling edge. Which is not what most ETM documents show.
The CLK and TRACE_0 lines differ with at most 2mm, which is negligible at the frequency of interest. Some clarification would be greatly appreciated.
Kind regards
Philip
- STM32H755 USB CDC Help in STM32 MCUs Embedded software
- SPI3 hangs after some time in STM32 MCUs Embedded software
- stm32h723 lwip rtos,The client stops sending data after running for a period of time. It will only resume operation if an external device pings in STM32 MCUs Embedded software
- STM32L476RCT6 – HAL_Delay and UART Blocking Issue on Custom Board in STM32 MCUs Embedded software
- Loading New Firmware onto Write-Protected STM32 B-U585I in STM32 MCUs Security