- STMicroelectronics Community
- STM32 MCUs
- STM32 MCUs Products
- Problem with starting a debuging session
- Subscribe to RSS Feed
- Mark Topic as New
- Mark Topic as Read
- Float this Topic for Current User
- Bookmark
- Subscribe
- Mute
- Printer Friendly Page
Problem with starting a debuging session
- Mark as New
- Bookmark
- Subscribe
- Mute
- Subscribe to RSS Feed
- Permalink
- Email to a Friend
- Report Inappropriate Content
2015-07-29 5:52 AM
Hello,
I came across a problem which is about starting a debbuging seession on my System Workbench for stm32 (system Win7 x64). When I'm trying to debug my source code an information appears:Error in final launch sequence
Failed to execute MI command: -target-select remote localhost:3333Error message from debugger back end:
localhost:3333: Connection timed out. localhost:3333: Connection timed out. I found a similar problem in but unfortunatelly I don't understand the solution these guys described. The funny thing is that I've been debbuging my STM32F3 discovery module normally until yesterday (for 2 weeks) and then everything broke I wonder why. The reason can't be that I updated my Intel Drivers and it messed with my STM workbench configuration can it? Please help me in this matter. Regards Dominik O.- Mark as New
- Bookmark
- Subscribe
- Mute
- Subscribe to RSS Feed
- Permalink
- Email to a Friend
- Report Inappropriate Content
2015-07-30 1:19 AM
Hello again,
I tried fixing the problem by deleting my project configuration, uploading cube conf. again, refreshing, cleaning then building and now the output of the console is: Open On-Chip Debugger 0.9.0-dev-00415-g2d4ae3f-dirty (2015-04-22-11:10) Licensed under GNU GPL v2 For bug reports, read http://openocd.org/doc/doxygen/bugs.html Info : auto-selecting first available session transport ''hla_swd''. To override use 'transport select <transport>'. adapter speed: 1000 kHz adapter_nsrst_delay: 100 Info : The selected transport took over low-level target control. The results might differ compared to plain JTAG/SWD none separate srst_only separate srst_nogate srst_open_drain connect_deassert_srst Info : Unable to match requested speed 1000 kHz, using 950 kHz Info : Unable to match requested speed 1000 kHz, using 950 kHz Info : clock speed 950 kHz Error: read version failed in procedure 'init' in procedure 'ocd_bouncer' So there is still a problem with my debugger. Any help will be appreciated. Regards Dominik O.- Mark as New
- Bookmark
- Subscribe
- Mute
- Subscribe to RSS Feed
- Permalink
- Email to a Friend
- Report Inappropriate Content
2015-07-30 1:58 AM
A friend told me that one thing might work. After I started my debugging I was pressing the reset button, and when it jumped to the debugger window I stopped pressing the button and surprisingly the project is running properly now. After this occurence I dont have to do such a magic again, everything is working fine now. Enyone knows why?
Best regards Dominik O.- Mark as New
- Bookmark
- Subscribe
- Mute
- Subscribe to RSS Feed
- Permalink
- Email to a Friend
- Report Inappropriate Content
2015-07-30 2:22 PM
Hi
I have a similar problem with a F100RBT discovery board and STM32 ST-LINK Utility. It works well with Discovery demo programs but needs this trick with Cube projects. I have not got any explanation to this from these forums.- Mark as New
- Bookmark
- Subscribe
- Mute
- Subscribe to RSS Feed
- Permalink
- Email to a Friend
- Report Inappropriate Content
2015-08-07 2:24 AM
Hi oziom.dominik,
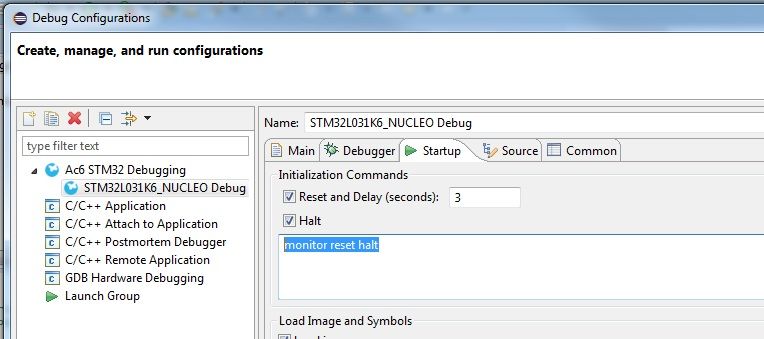
This error is due to pendings debug sessions. You launched a new debug session without terminating last one. To resolve this problem follow these steps: click Window->Open Perspective->Other->Debug, in the Debug view click verify that all debug session are off (equivalent to terminate). Otherwise open ocd is responsible of resetting the board. So, be sure that in Debug Configuration->Start up, Halt is chacked and ''monitor reset halt'' is written. And the dedicated forum for these issues is -Shahrzad-
- Mark as New
- Bookmark
- Subscribe
- Mute
- Subscribe to RSS Feed
- Permalink
- Email to a Friend
- Report Inappropriate Content
2015-08-07 3:10 AM
Hi mich.lei,
Maybe you opened Demos with Keil or IAR in first time. Unfortunately the open cd of SW4STM32 does not support ST-Link/V1 supported by F100RBT discovery board. For any other information related to SW4STM32, please post your question in . -Shahrzad-- Mark as New
- Bookmark
- Subscribe
- Mute
- Subscribe to RSS Feed
- Permalink
- Email to a Friend
- Report Inappropriate Content
2015-08-07 6:33 AM
Hi shahrzad. Thank you for the answer.
Your link goes to the Open STM32 page, but I have not used it (yet). I use a Keil Demo mostly. Projects I take either from Discovery F100RBT page and from the STM32CubeMX tool. It strongly looks like the Cube does not support the Discovery F100RBT fully. Leif- STM32N6 Nucleo Target Not Responding After Intial Success in STM32 MCUs Products
- Reset reason, detect debug session in STM32 MCUs Products
- ST-LINKV3 over VirtualHere (USB over IP) in STM32 MCUs Products
- STM32CubeIDE for VSCode debug error: Failed to get gdb version in STM32CubeIDE for Visual Studio Code (MCUs)
- Debugging often hangs (infinite loop of "Read 4 bytes @ address ...") in STM32CubeIDE for Visual Studio Code (MCUs)