- STMicroelectronics Community
- STM32 MCUs
- STM32 MCUs Products
- Hard Fault with ''STemWin_HelloWorld'' Example.
- Subscribe to RSS Feed
- Mark Topic as New
- Mark Topic as Read
- Float this Topic for Current User
- Bookmark
- Subscribe
- Mute
- Printer Friendly Page
Hard Fault with ''STemWin_HelloWorld'' Example.
- Mark as New
- Bookmark
- Subscribe
- Mute
- Subscribe to RSS Feed
- Permalink
- Email to a Friend
- Report Inappropriate Content
2017-10-10 7:05 PM
Compiler: IAR Workbench v8.11.3
Graphics: STemWin
Hardware: STM32746G Discovery Board
HAL Version: V1.8.0
Demo Project: C:\STM32Cube_FW_F7_V1.8.0\Projects\STM32746G-Discovery\Applications\STemWin\STemWin_HelloWorld
Problem:
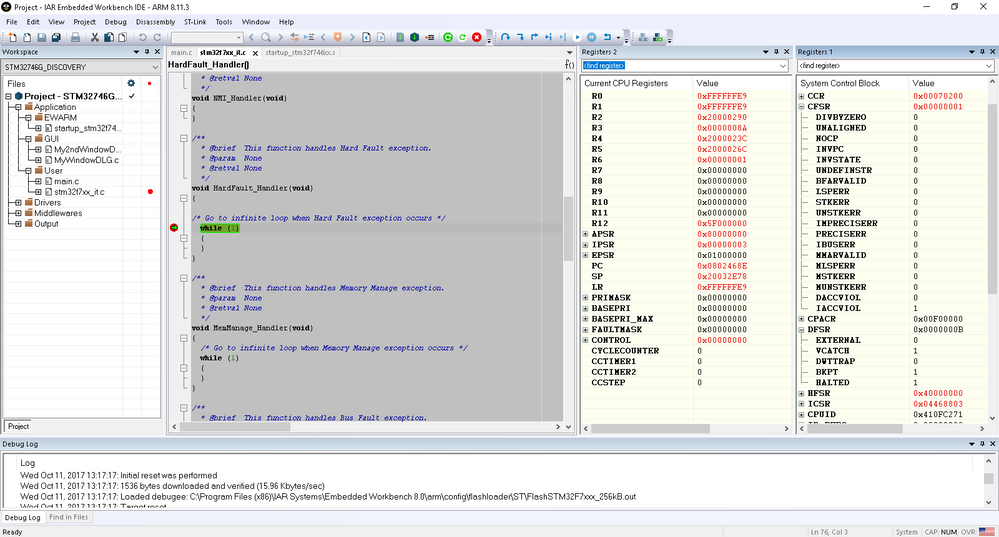
I have created a simple project based on the “STemWin_HelloWorld� example for the STM32746G Discovery Board. I have created two screens with a button on each. The button on each screen loads the other screen, and visa-versa. If you switch back and forth the screens a couple of times the program gets stuck in the “void HardFault_Handler(void)� routine.
From the viewing, the System Control Block Registers with the debugger I can see that the following bits are set.
BusFault Status register
BFSR -> BFARVALID
BFSR -> IMPRECISERR
UsageFault Status register
UFSR -> UNALIGNED
UFSR -> UNDEFINSTR
Different combinations of these bits are set each time you reset the MCU. From reading the manual it appears that a bad instruction is causing the fault but I am unable to narrow down as to where. Can anyone please assist in stopping the program going into the “void HardFault_Handler(void)� routine?
Please un-zip the attached project into the below directory:
C:\STM32Cube_FW_F7_V1.8.0\Projects\STM32746G-Discovery\Applications\STemWin\
- Mark as New
- Bookmark
- Subscribe
- Mute
- Subscribe to RSS Feed
- Permalink
- Email to a Friend
- Report Inappropriate Content
2017-10-10 7:43 PM
Try using a reasonable Hard Fault Handler and review the faulting instructions and registers. Disassembly view.
Is the stack sufficiently large? Are you corrupting structures on the stack? Review your use of local/auto variables.
If it tries to execute 32-bit ARM code it will fault.
https://community.st.com/0D50X00009XkfOXSAZ
Up vote any posts that you find helpful, it shows what's working..
- Mark as New
- Bookmark
- Subscribe
- Mute
- Subscribe to RSS Feed
- Permalink
- Email to a Friend
- Report Inappropriate Content
2017-10-10 10:23 PM
,
,
Thank you Clive One.
How do I increase the stack size? Is there a header file with a ♯ define to change?
I can already see the register values from my debugger. But how do I interpret this?

- Mark as New
- Bookmark
- Subscribe
- Mute
- Subscribe to RSS Feed
- Permalink
- Email to a Friend
- Report Inappropriate Content
2017-10-11 5:29 AM
To change the stack size in IAR IDE:
Project->Options->Linker->Config Tab and Edit Linker configuration file.
- Mark as New
- Bookmark
- Subscribe
- Mute
- Subscribe to RSS Feed
- Permalink
- Email to a Friend
- Report Inappropriate Content
2017-10-11 6:11 AM
Hi ra hummel.
Thank you for your comment. I made the below changes and I no longer get this fault. I will have to consult the IAR manual to better understand the CSTACK and HEAP.
How do you determine what sizes these should be?

- Mark as New
- Bookmark
- Subscribe
- Mute
- Subscribe to RSS Feed
- Permalink
- Email to a Friend
- Report Inappropriate Content
2017-10-11 6:22 AM
The stack size depends on your application and the libraries you are using, see
https://www.iar.com/support/resources/articles/mastering-stack-and-heap-for-system-reliability/
- Mark as New
- Bookmark
- Subscribe
- Mute
- Subscribe to RSS Feed
- Permalink
- Email to a Friend
- Report Inappropriate Content
2017-10-11 6:29 AM
Very good link. Thank you!
- Mark as New
- Bookmark
- Subscribe
- Mute
- Subscribe to RSS Feed
- Permalink
- Email to a Friend
- Report Inappropriate Content
2017-10-11 8:27 AM
Tools like Keil can get an estimation of call tree depth and stack usage from a static perspective. You can walk the trees yourself and sum up the local/auto arrays/variables you are allocating, and come up with a reasonable guess. From an active/dynamic sense you can paint the stack with a recognizable character/string and figure the maximal depth viewing the memory from the debugger.
From a Hard Fault debugger view you'd want to look at the appropriate stack as well as the registers, the registers of most interest being pushed on the stack, hence the 'blue screen' type trap message I've shown which can be used on systems not under active debugging. This can be useful for field debugging, as you'll learn zero from a system in a while(1) loop on the phone or via email.
Heaps are more problematic in the embedded realm due to fragmentation/leakage issues, one needs to review the malloc() usage expected, and perhaps wrap/instrument that to keep track in debug builds for dynamic use. People tend to avoid heap usage, it can be useful for initialization of structures determine by user configuration/setting, or by consuming whatever slack memory remains in the system left by the linker.
Up vote any posts that you find helpful, it shows what's working..
- STM32U585 Tamp Mechanism in STM32 MCUs Products
- CubeMx generates stub functions in sd_diskio.c for STM32L552ZET6Q in STM32CubeMX (MCUs)
- Questions about Unaligned memory accesses and Hard Faults in STM32CubeIDE (MCUs)
- Control in Open Loop Voltage mode for B-G431-ESC1 via UART2 in STM32 MCUs Motor control
- Target No Device Found: SWDIO (PA13) at 0V on STM32L073CZT Custom Board in STM32 MCUs Boards and hardware tools