How to use MEMS sensors with an intelligent processing unit for anomaly detection applications using NEAI software tool
- Subscribe to RSS Feed
- Mark as New
- Mark as Read
- Bookmark
- Subscribe
- Email to a Friend
- Printer Friendly Page
- Report Inappropriate Content
on 2022-11-10 1:20 PM
Before starting, what do you need?
Software
In this knowledge article, there will be the need to use the following software tools and packages:- NEAI which is the tool dedicated to find the best anomaly detection library
- X-CUBE-ISPU which is a software package dedicated to create the right binary file for the ISPU devices
- STM32CubeProgrammer which is the software tool used to compile the X-CUBE-ISPU package
Hardware
The hardware configuration used to achieve our results is the following:
- NUCLEO-F401RE which is the STM32 nucleo board
- X-NUCLEO-IKS01A3 which is the STM32 nucleo shield for consumer sensors
- STEVAL-SMKI230AA which is the DIL24 with the ISM330ISN mounted on it embedding ISPU capabilities
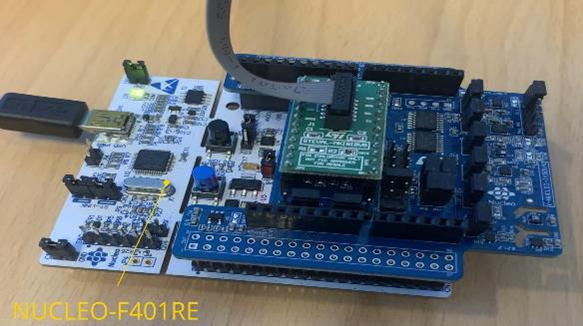
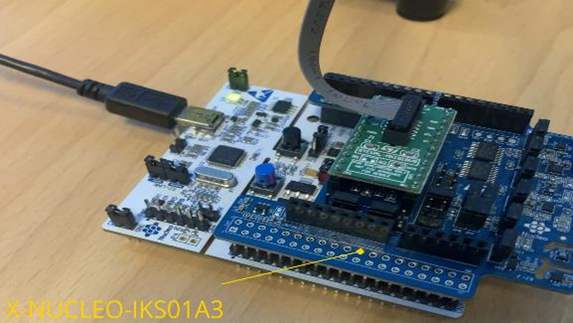
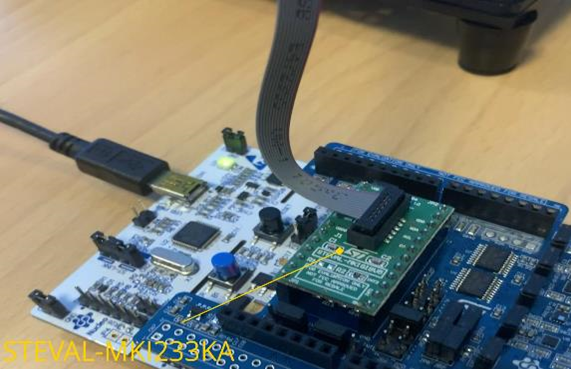
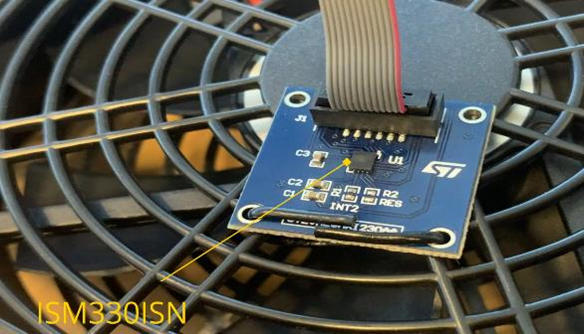
Other boards configurations can be used to obtain the same result, it is needed to check the software compatibility with the hardware.
How to find the best library for your ISPU device using the NEAI software
When opening the NEAI studio, the first thing is to open the datalogger where you can find many different board configurations you can use to run your anomaly detection algorithm.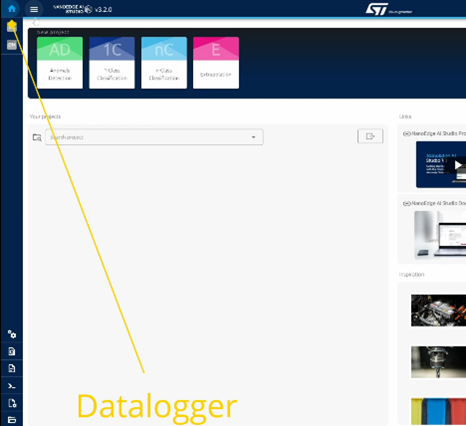
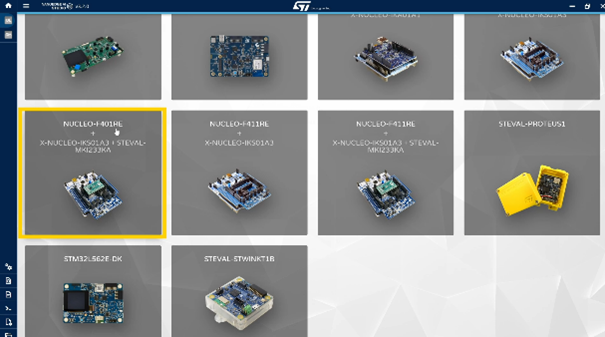
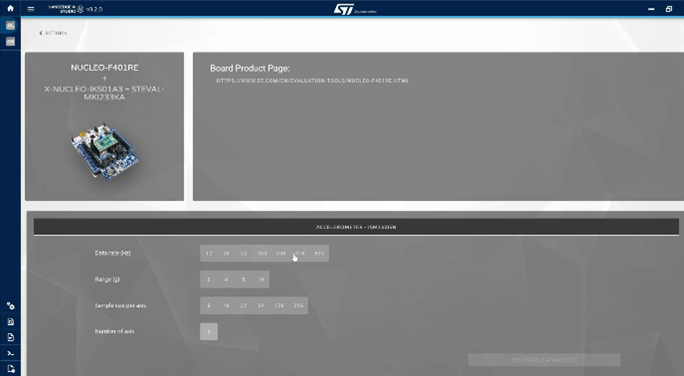
- Data rate (Hz): 416 Hz
- Range (g): 2 g
- Sample size per axis: 128
- Number of axis: 3
Once it is done it is possible to start building the anomaly detection use case with the NEAI software tool by creating a new project.
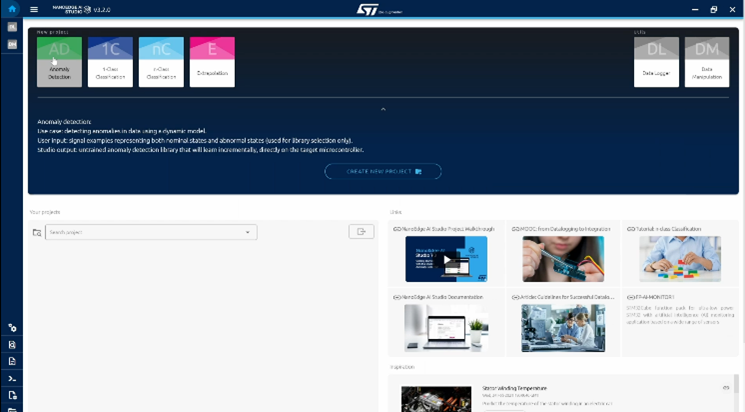
1st Step: Project Setting
There are many options, but the one to select is the product: ISM330ISN.
For many devices, the settings of the max RAM, the max flash and the sensor type must be selected, for the ISPU device all the right parameters are already set.
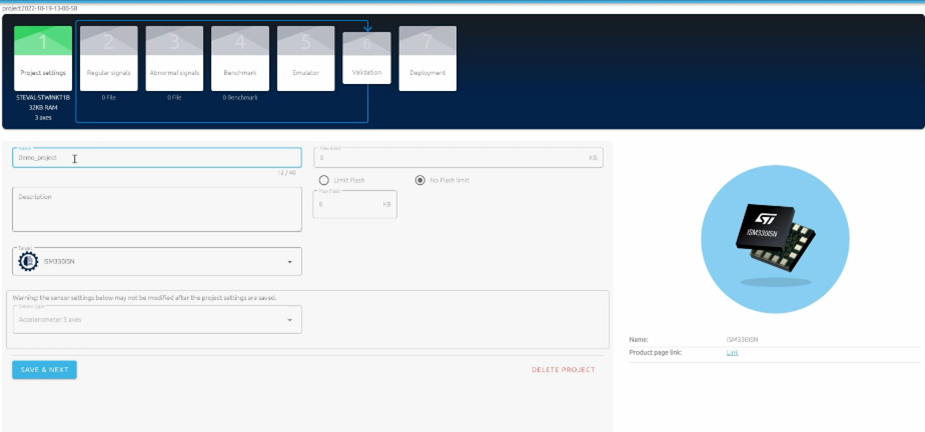
2nd Step: Getting the normal signal
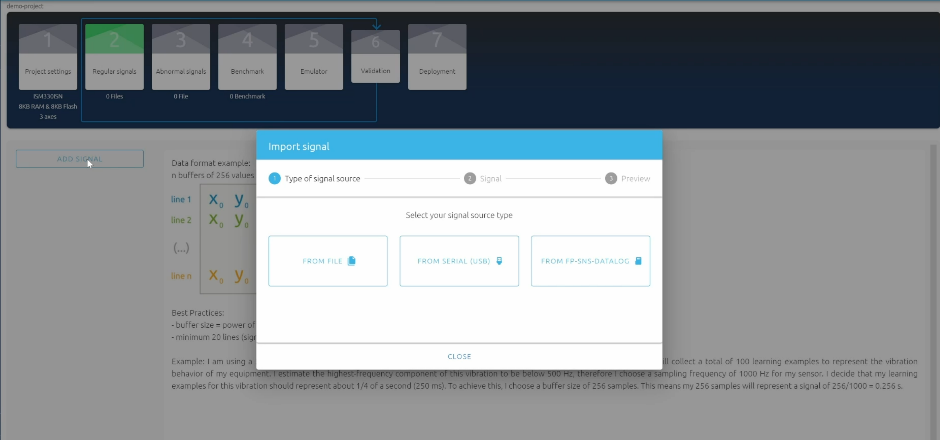
For the second step, we need to click on add signal and here there are three different sources that you can use to import your normal signal.
We can import from 3 different sources:
- from a file in text or CSV format
- from .dat files in the SW packages
- From the serial USB
The COM port should be selected, and the bound rate is fixed at 115200.
For this knowledge article, the normal signal is taken while the fan coil is running at its max speed.
So, after setting the coil to its max speed and clicking on START, the data starts streaming and getting recorded.
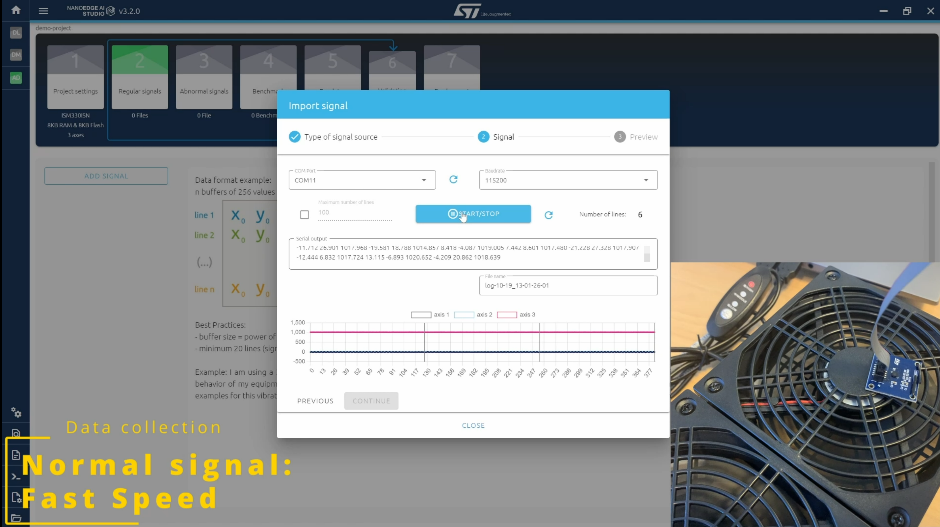
It is possible to collect all the buffers that you want, but for a simple use case, 100 samples are enough and they represent the normal behavior of the fan
For the simplicity of the knowledge article there will be collected only data representing one mode of operation on our fan which is the max speed, but of course it is possible to gather data representing all the different states that are to be considered as the normal behavior of the fan.
It is possible, for instance to record signals from all speeds, not only one, in that case it is possible to concatenate everything and that will represent the normal regimes in one single file.
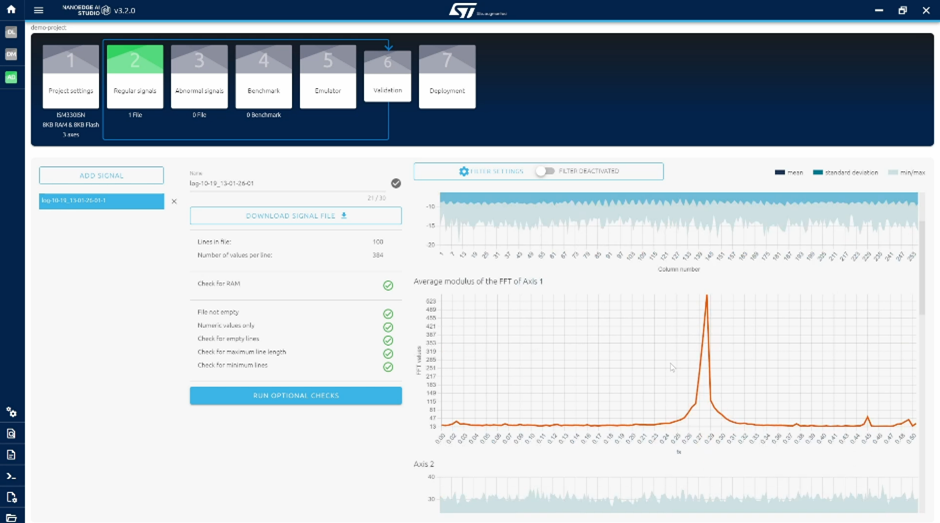
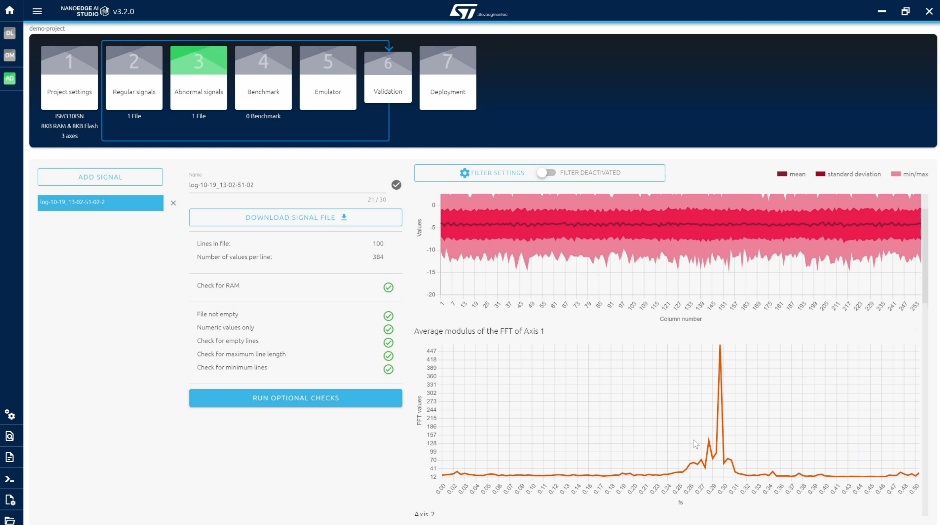
The signal screen summarizes the content of the data that were just logged.
On the right-hand side, there is a preview of the imported data with the FFT plots for all the accelerometer axes.
There is also the possibility to manually add filters to remove unwanted frequencies, by doing it, the frequency plot will change immediately according to the cut made. During this knowledge article this part is skipped.
3rd Step: Getting the abnormal signal
Then it is needed to import signals from the abnormal behavior, collecting data from what is believed to be unusual, for the sake of simplicity, only by changing the speed from the fastest to the slowest will get the abnormal signal behavior.
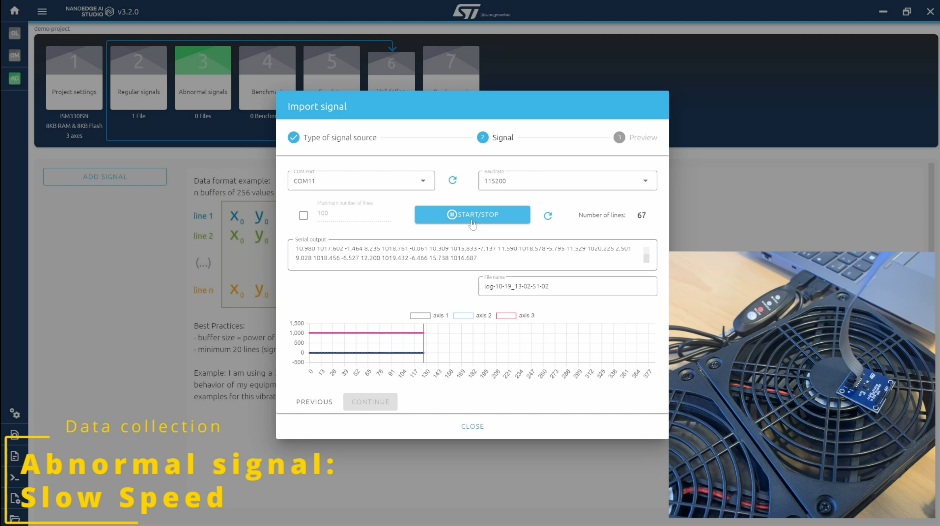
There is a very important consideration which has to be done in order to understand how the system works.
The signal examples that it is provided at this point are not used to train the library, they are only to provide some context for the automatic search that will happen in the next step because all the learning will happen later on in the ISPU after the library has been embedded on the target machine. The examples of anomalies provided here do not need to be exhaustive. For a real use case for instance, they can be collected on a faulted machine or in conditions that you know are abnormal or depending on the case, they can be created artificially.
When testing the library, it is possible to detect anomalies that were never seen before, because embedded learning is what makes NEAI libraries, especially for Anomaly detection particularly adaptable.
Once all the data have been collected, let’s import them, checking the graphs.
4th Step: Benchmark
At this point the NEAI studio will start working hard to find the best possible library for our use case given the signal we provided. The nano edge library is composed by three main blocks:
- Signal preprocessing algorithm, this could be very simple such as offsetting, normalizing or more complex like FFT or PCA
- Choice of the ML model. In the pool of all the available models there are different classes of ML such as KNN, SVN, NN
- A set of hyperparameters for the ML model so that it can solve the problem as effectively and efficiently as possible.
Each library is tested using the signals imported previously. The library will learn the normal signals and then run inference on both normal and the abnormal signal. This all process happens many times for each library using random subsets from the data provided to minimize any possible bias.
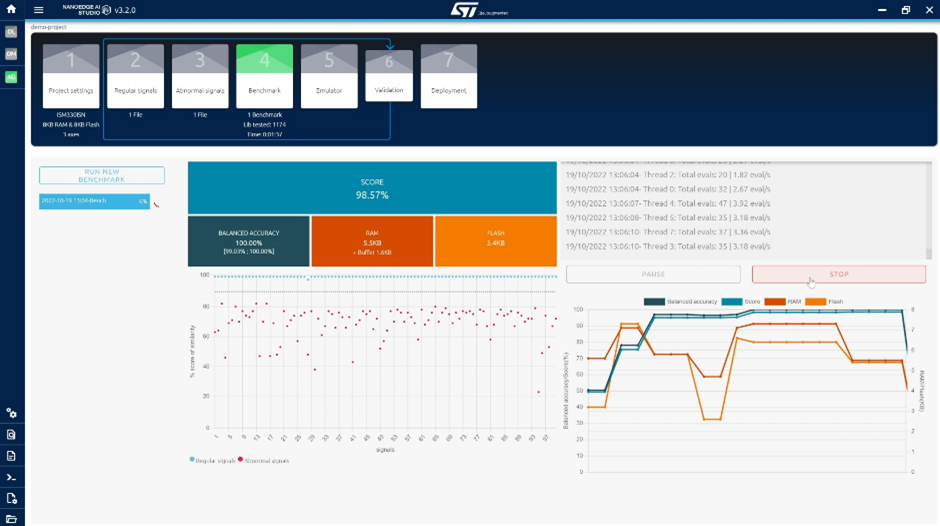
The ideal situation will be to have all the blue dots which correspond to the normal signal to be as close to 100% similarity as possible and we will like all the red points which represent the abnormal signals to be close to 0%.
The most important performance indicator is the balanced accuracy which translates the ability of the library to correctly attribute the input signals to the correct class, either normal or abnormal. 100% accuracy would mean that all the blue points are above the 90% decision boundary and all the red are below.
Finally, the amount of RAM and flash memory are also optimized, so there is a comparison between the best library found with the RAM space.
5th Step: Emulator
The emulator step is the step where it is possible to test the library directly from the SW to check if its to understand if what you have generated with your benchmark works properly before the final implementation.
Once again, let’s use the serial data logger to collect data for your normal condition meaning when the speed is at the max.
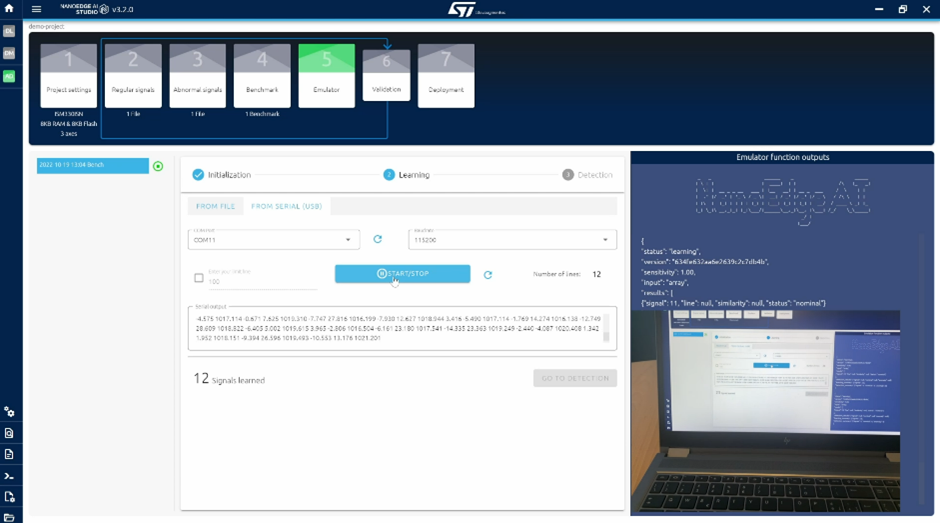
Then we move to detection to see how the library behaves, again we will use serial data.
And here the inference result shows 100% similarity and that is expected since the fan is running normally.
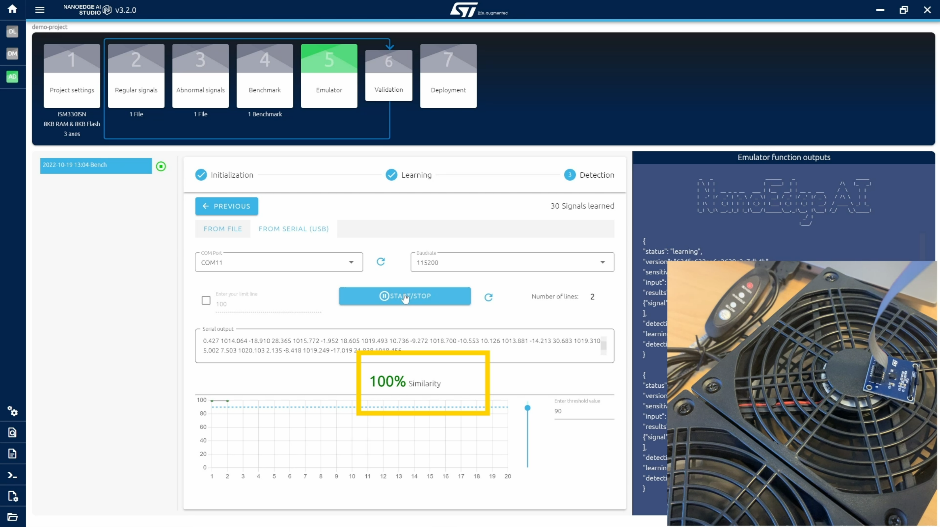
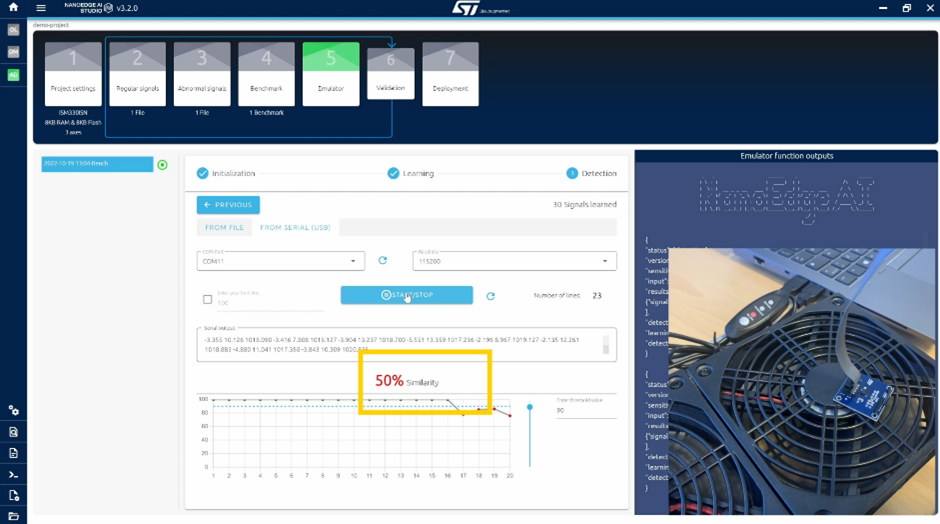
One thing to highlight here is the fact that I just showed you the different speed case, however, if I turn off the fan, the anomaly will be detected and the same if I tap on the fan itself.
I want to remind that the anomaly detection is a first step to the predictive maintenance which just says when something is diverging from its normal behavior.
6th Step: Validation
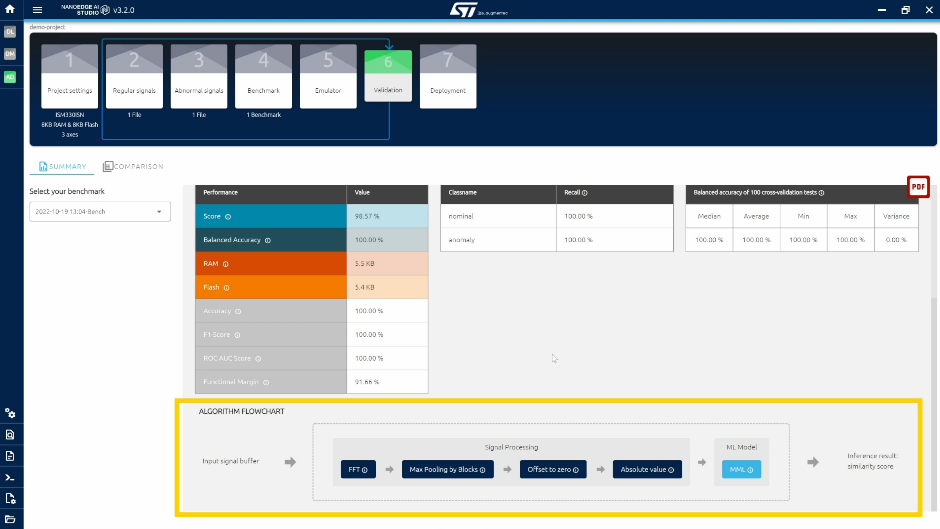
Once the emulation phase was completed, the validation step is just a summary of the algorithm created highlighting the overall score, the balanced accuracy and the algorithm flowchart.
7th Step: Deployment
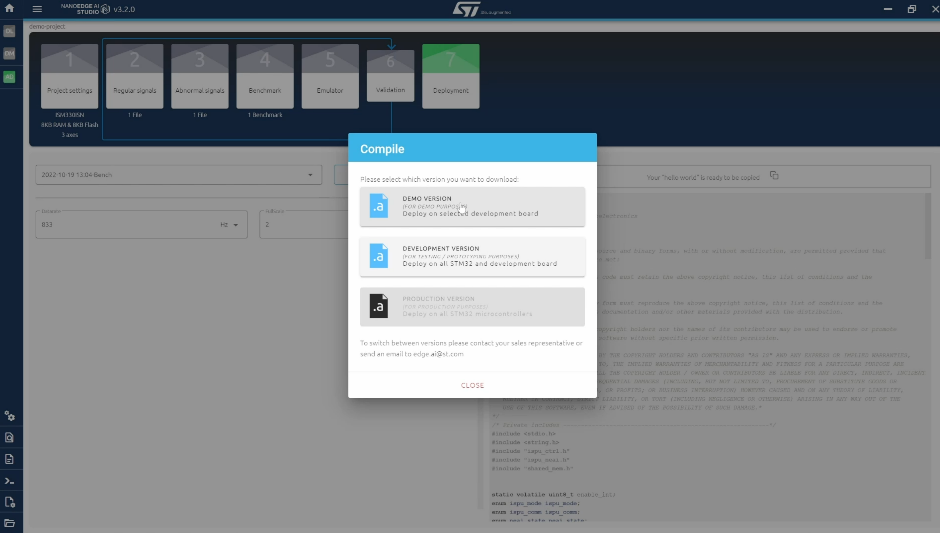
In the last step of the NEAI studio by clicking on generate library, it is possible to download the .h file with the library found in a .zip package.

How to implement the generated .h file in the ISPU device
Now, once the best possible library has been generated, it is needed to use in the MEMS Sensor embedding the ISPU, the ISM330ISN.
X-CUBE-ISPU software package
The X-CUBE-ISPU software package has examples to implement the library generated with the NEAI tool, but also there are prebuild examples and templates to be used with custom made C codes running your algorithms.
In this knowledge article it will be explained how you can implement the best library found with the NEAI tool in your ISPU device.
In the X-CUBE-ISPU main page, it is needed to go in the directories matching with the hardware used for this exercise, hence:
x-cube-ispu\Projects\NUCLEO-F401RE\Examples\CUSTOM\ ISM330ISN_NEAI_AnomalyDetection
In this folder you can find some files already present which must be changed with the files generated from the NEAI studio.
Therefore, the first step is to get two files from the NEAI package and copy them in the X-CUBE-ISPU software package.
- ispu_neai.h
- ispu_ctrl.h

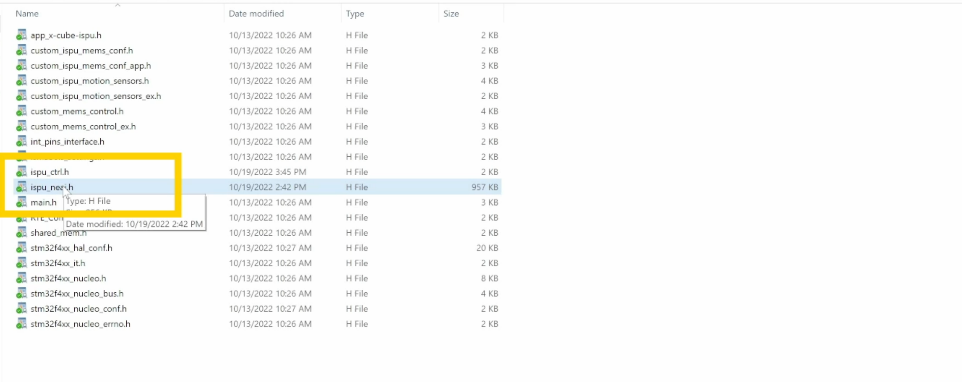
Moreover, the ispu_neai.h is the binary configuration file which runs in the MEMS Sensor itself.
Build the X-CUBE-ISPU program and flash it in the sensor
After opening the STM32Programmer, it is needed to import the project.Hence clicking on the import project icon, we select existing projects into workspace.
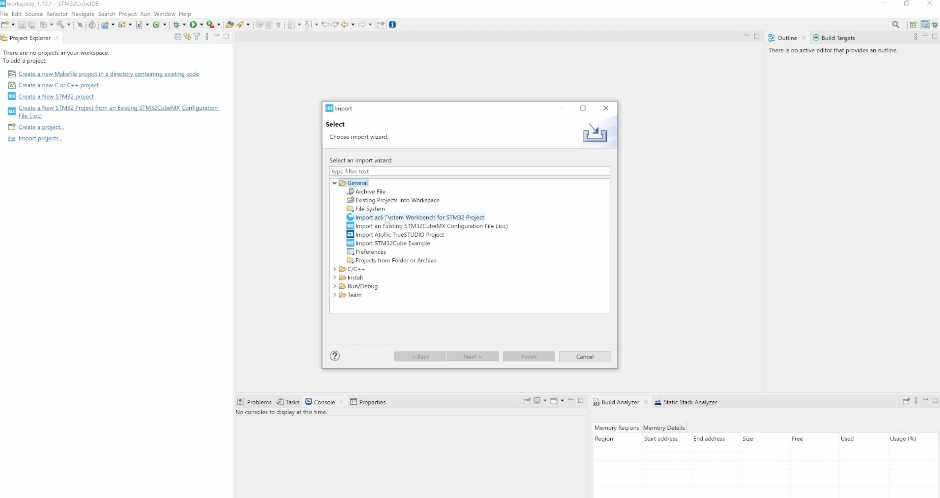
Next it is needed to browse the project in the directory where the two files were copied:
x-cube-ispu\Projects\NUCLEO-F401RE\Examples\CUSTOM\ ISM330ISN_NEAI_AnomalyDetection
The first box must be unflagged, keeping just the second where it is written STM32CubeIDE.
There is a main consideration to be done here to understand how the code works since its aim is not to compare two different states, but to use a library like the one generated with the NEAI to make comparison between a normal state and an anomaly state. It works mainly as a state machine:
- The first step is to go through the learning phase where a new normal signal is taken
- Once this new learning is completed, the library from the NEAI will run checking if the signals match the normal state and in this case no interrupts are raised. On the other side, if using the library some inferences are found between the optimal and the abnormal signal then the interrupt is raised
- Only if the anomaly is detected then the data corresponding to the anomaly will be printed
Next step is to build the project using the building button at the top left of the screen and once that is done, after connecting the hardware setup to the laptop, the debug can start.
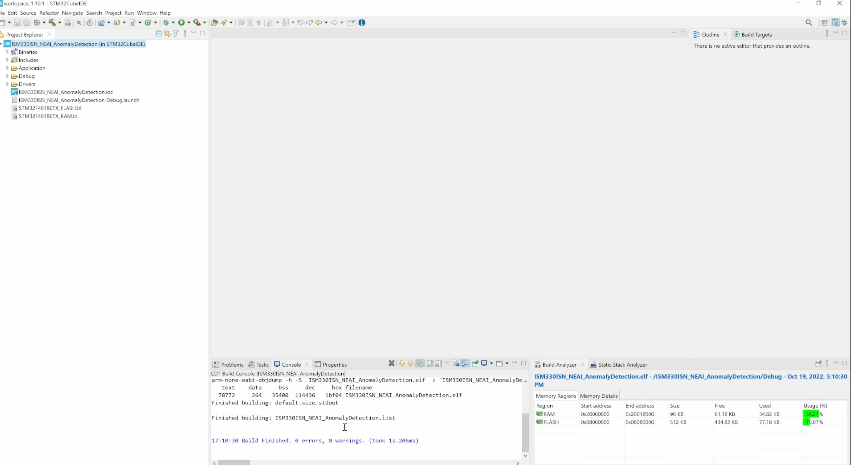
The debug starts after clicking on the green bug and once this is done, we can check the results in a terminal.
Checking the results
In this knowledge article the open software tool putty will be used in order to see the results directly from the ISPU.Launching putty, the first step is to click on the serial mode and write the correct serial line and the speed. While the serial line can change, the speed is always 115200.
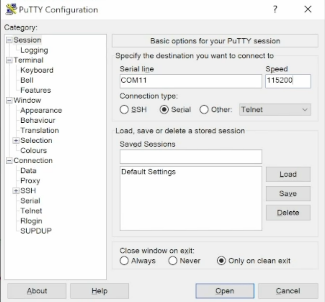
Some visualization parameters can be modified, for instance going on terminal, for a better visualization it is needed to flag:
- Implicit CR in every LF
- Implicit LF in every CR
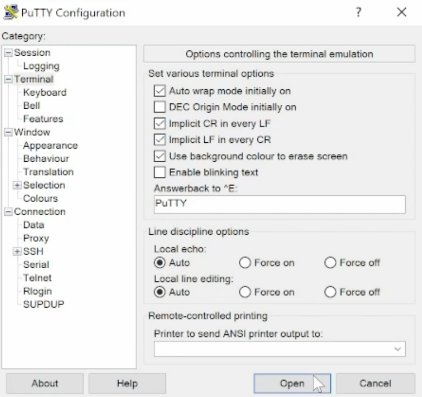
Finally, by clicking on open, the terminal will display the values.
As anticipated, the first step is the learning phase to get the new normal data.
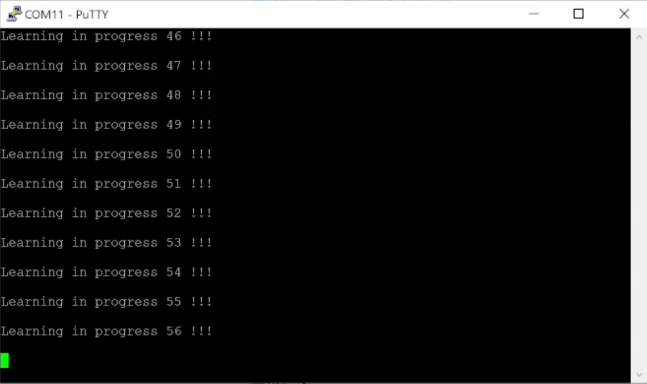
As soon as this step is completed, the message “learning phase end” appears ending the learning phase.
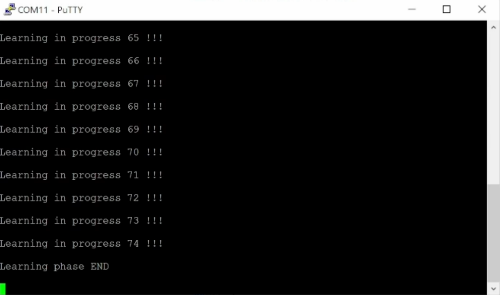
If the library works well, there will be no data streamed if the learning condition is kept and no data are streamed.
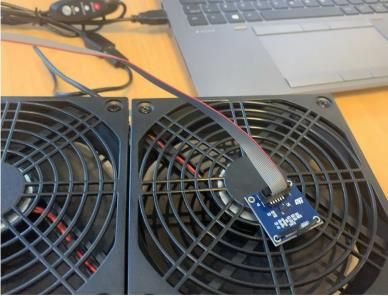

As soon as an anomaly is created, the data will start streaming for that specific kind of anomaly.
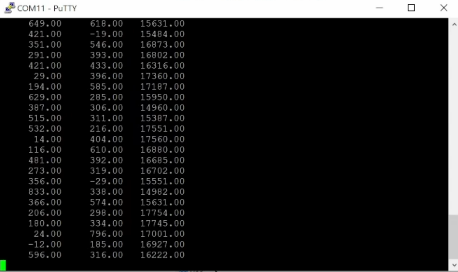
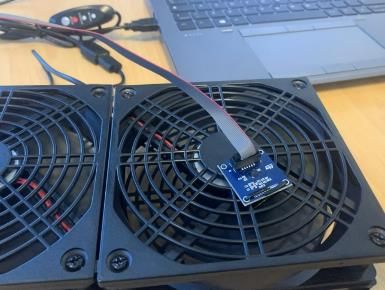
The data can be collected in a microcontroller to make a dataset for future classifications.
Conclusions
In this knowledge article it was shown and explained how to use the ISM330ISN which embeds the ISPU with the NEAI studio software tool.
The NEAI software tool allows to find the best possible library among many combinations starting from a set of good and bad signals which can be used once getting new data in the learning phase.
The X-CUBE-ISPU is a software tool which needs to be used to flash the library generated by the NEAI tool in the ISPU device.
You can check the following link for a step-by-step webinar on the same topic.
Webinar: Anomaly detection and AI: one step closer to ST intelligent sensors – STMicroelectronics
- Mark as Read
- Mark as New
- Bookmark
- Permalink
- Email to a Friend
- Report Inappropriate Content
Hello @luca , how are you?
How is possible reproduce the anomaly detection applications using NEAI software tool and the NUCLEO-H473ZI2?
I have the X-NUCLEO-IKS01A3 and the STEVAL-SMKI230AA, but just a NUCLEO-H473ZI2.
Do you have any tips to convert this example to running in the NUCLEO-H473ZI2?
Thank you in advanced for your help.
- Mark as Read
- Mark as New
- Bookmark
- Permalink
- Email to a Friend
- Report Inappropriate Content
Hello @AlessandroCunha,
good news!
NEAI can generate libraries for any kind of STM32 (+ISPU). The user just need to select the right board at the 1st stage of his/her project and the generated library will be optimized for the selected MCU.
If my reply answered your question, please click on Accept as Solution at the bottom of this post. This will help other users with the same issue to find the answer faster.
- Mark as Read
- Mark as New
- Bookmark
- Permalink
- Email to a Friend
- Report Inappropriate Content
Hello @Denise SANFILIPPO and @Luca SEGHIZZI ,
Thank you so much for this update.
After reading your message I try to generate a project to make a datalogger in the NEAI using X-NUCLEO-IKS01A3 and NUCLEO-H743ZI2 (sorry for the mistyping at first message), but with no success.
I can't identify where in NEAI I can't determine that I use the X-NUCLEO-IKS01A3 and NUCLEO-H743ZI2 to make this datalogger running (please look the pictures in attached).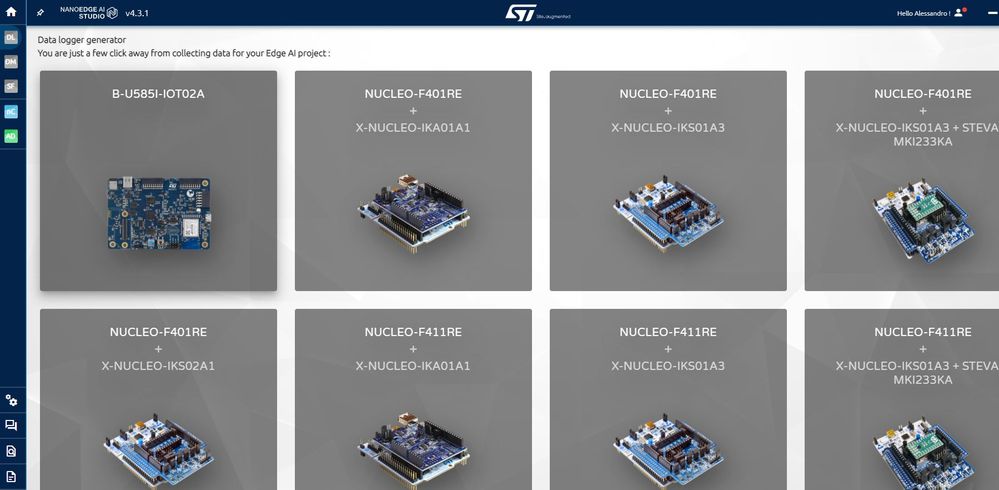
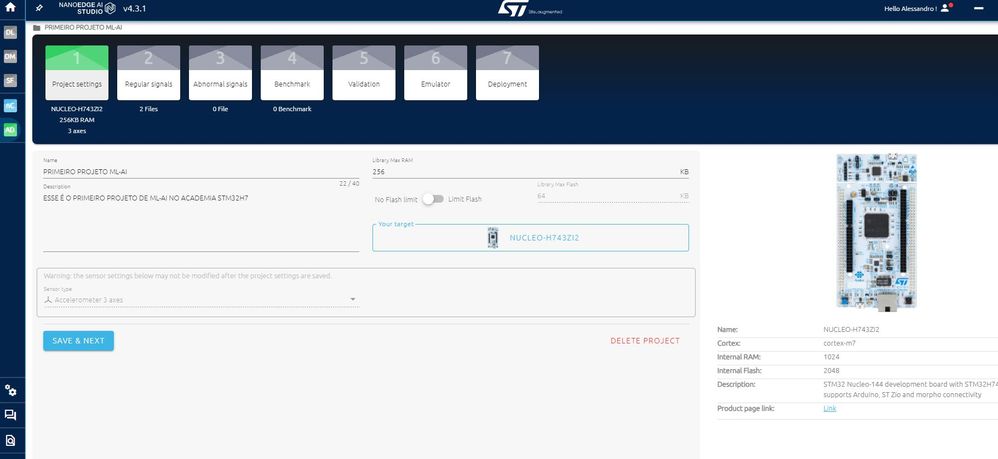
Do you have a step-by-step procedure that I can use to doing this?
Wait your return.
Thanks, in advanced!
Regards.
- Mark as Read
- Mark as New
- Bookmark
- Permalink
- Email to a Friend
- Report Inappropriate Content
Hello @AlessandroCunha,
You are trying to use a datalogger configuration that does not exist.
If you want to create your own datalogger, you can start based on https://github.com/stm32-hotspot/stm32ai-nanoedge-datalogger
- Mark as Read
- Mark as New
- Bookmark
- Permalink
- Email to a Friend
- Report Inappropriate Content
@Denise SANFILIPPO : Yeap! I try to put to run a datalogger configuration that isn't the standard thinked by ST.
This configuration make sense for some applications that we have here.
If STM provide a step by step easier to following than what you put at the GitHub, I think could be easier the adoption for these tools for everybody.
I will start my application based on https://github.com/stm32-hotspot/stm32ai-nanoedge-datalogger and try tu put this to running.
Regards