Turn on suggestions
Auto-suggest helps you quickly narrow down your search results by suggesting possible matches as you type.
Showing results for
- STMicroelectronics Community
- Missing nodes
- missing-articles
- How can I use STM32CubeProgrammer to perform a reg...
Options
- Subscribe to RSS Feed
- Mark Topic as New
- Mark Topic as Read
- Float this Topic for Current User
- Bookmark
- Subscribe
- Mute
- Printer Friendly Page
How can I use STM32CubeProgrammer to perform a register dump?
Options
- Mark as New
- Bookmark
- Subscribe
- Mute
- Subscribe to RSS Feed
- Permalink
- Email to a Friend
- Report Inappropriate Content
2023-04-13 12:57 AM
How can I use STM32CubeProgrammer to perform a register dump? STM32CubeProgrammer is an all-in-one software tool for programming STM32 products, compatible across multiple operating systems and available in both Graphical User Interface (GUI) and Command Line Interface (CLI) versions. It is an easy to use and efficient application for reading, writing, and verifying device memory through both the JTAG and SWD debug interfaces and bootloader interfaces (e.g. USART, CAN, USB DFU, I2C and SPI).
Keeping up to date with the latest version of STM32CubeProgrammer
It is recommended to always keep up to date with the latest version of STM32CubeProgrammer. You can find the latest version of STM32CubeProgrammer on st.com. See the relevant documentation and links section at the end of this article for direct link to STM32CubeProgrammer’s landing page.
On the other hand, if you already have STM32CubeProgrammer installed on your system you can refer to the steps below to check your current STM32CubeProgrammer version, and if there are any updates available.
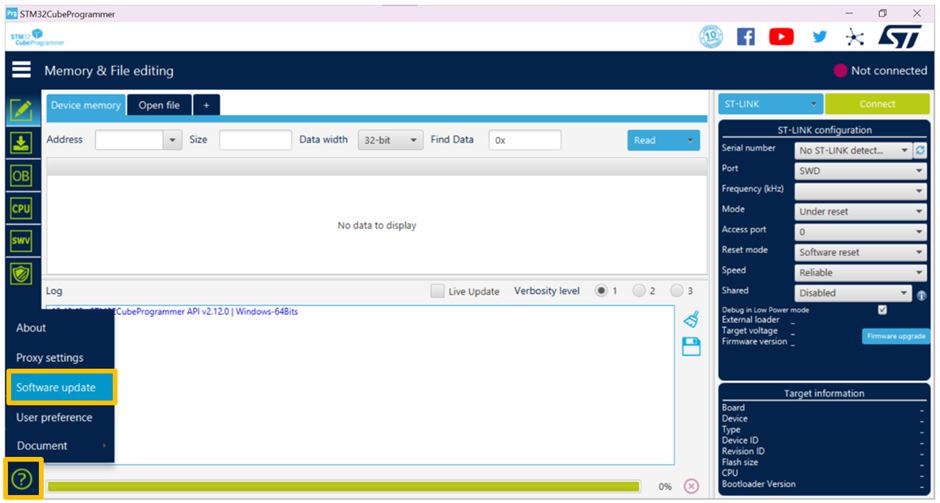
Step 1. Launch the STM32CubeProgrammer GUI (graphical user interface). In the bottom left-hand corner of the screen, select the ‘?’ icon. Then select the ‘Software Update’ option.
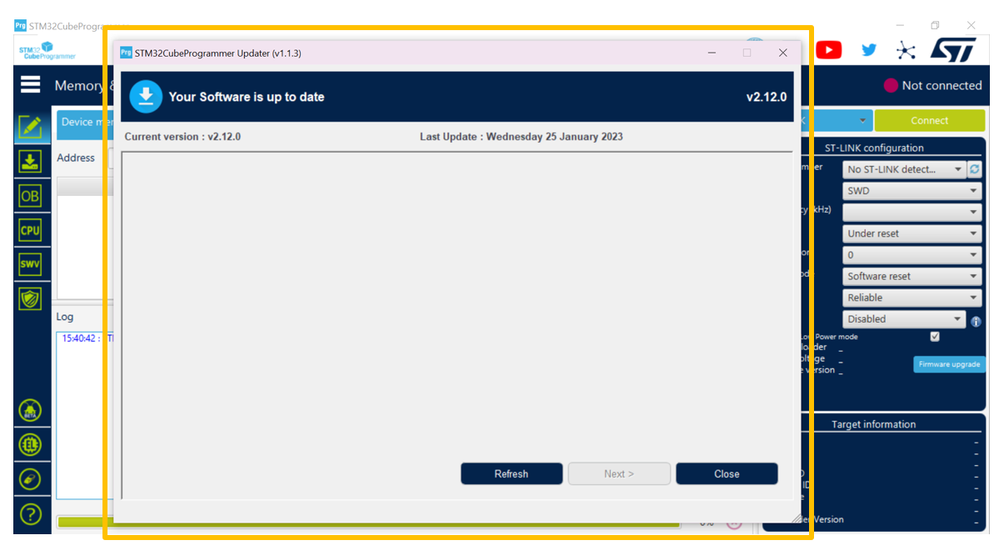
Step 2. A STM32CubeProgrammer updater pop-up window will appear. Note that the contents of this window may differ, depending on the current version of STM32CubeProgrammer you are running. If you have any updates to make, please follow the pop-up window’s on-screen prompts.
In this article, we will use the STM32C031C6 and STM32G071RB as our reference target devices. We will then use STM32CubeProgrammer to demonstrate how to perform a register dump via the GUI (graphical user interface) using the STM32C031C6 and the CLI (command line interface) using the STM32G071RB.
We will first start with doing a register dump using the GUI with the STM32C031C6. We will first need to locate the list of registers accessible within this STM32 device, these registers can be found in the device’s reference manual.
Every STM32 comes with a corresponding reference manual. In the reference manual you will find all sorts of required information that is provided for application, in particular software development.
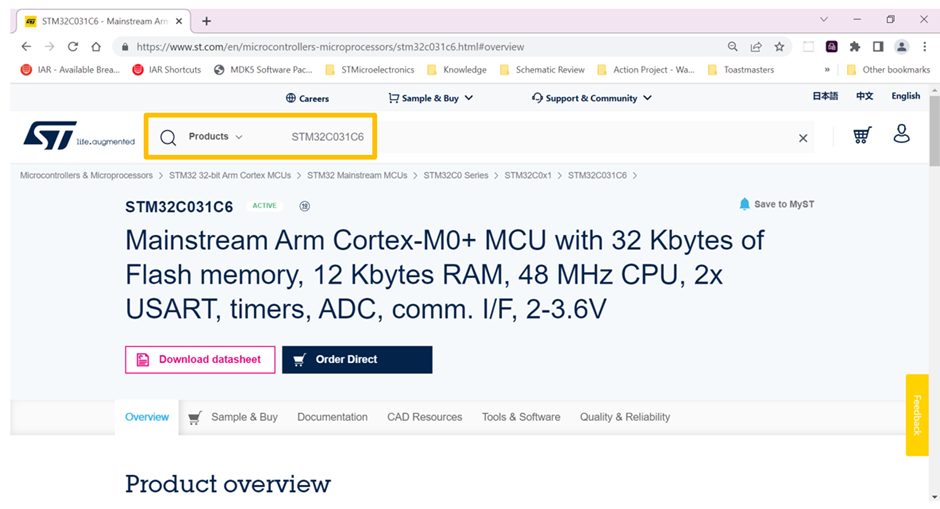
To locate the appropriate reference manual for our target STM32 device, we will first start by going on st.com and search for the STM32C031C6’s landing page.
Next, select the ‘Documentation’ tab:
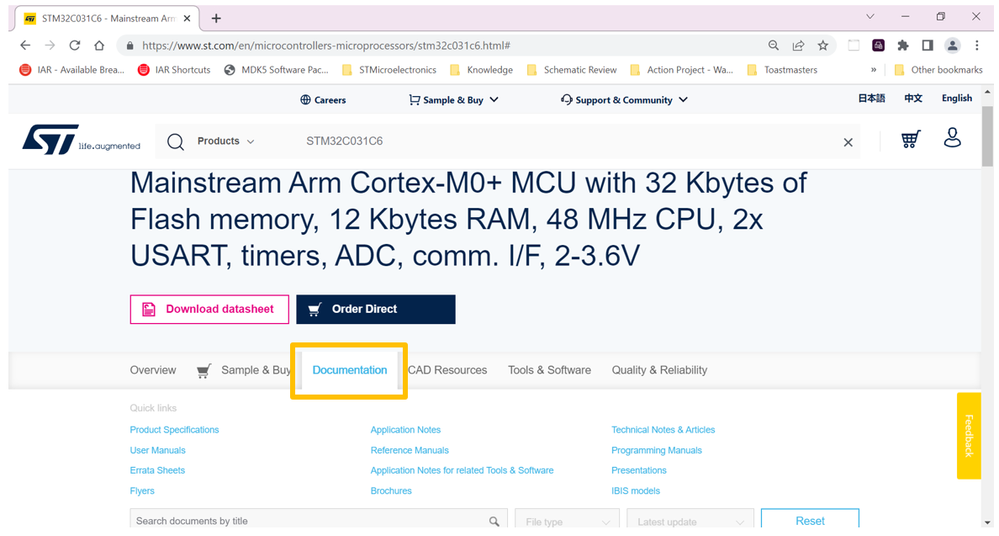
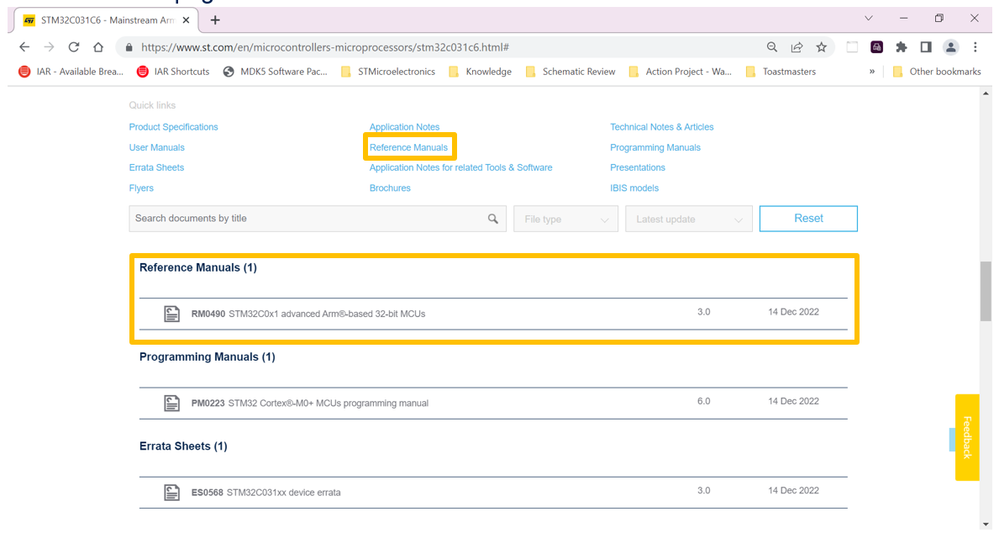
From the quick links’ menu, you can select the ‘Reference Manuals’ hyperlink or you can scroll down the page and locate the document under the ‘Reference Manuals’ section:
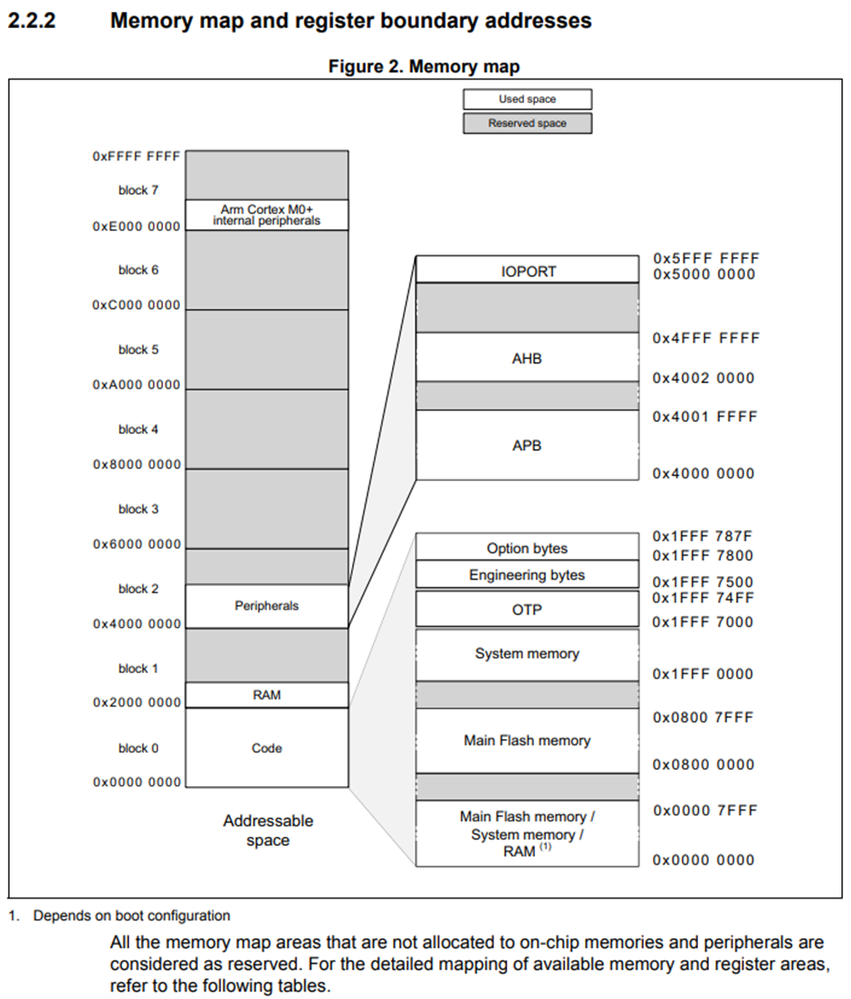
There are several views available in the device’s reference manual that show and explain the memory and register’s organization. In our device of choice, the STM32C0, these figures and tables are as follows:
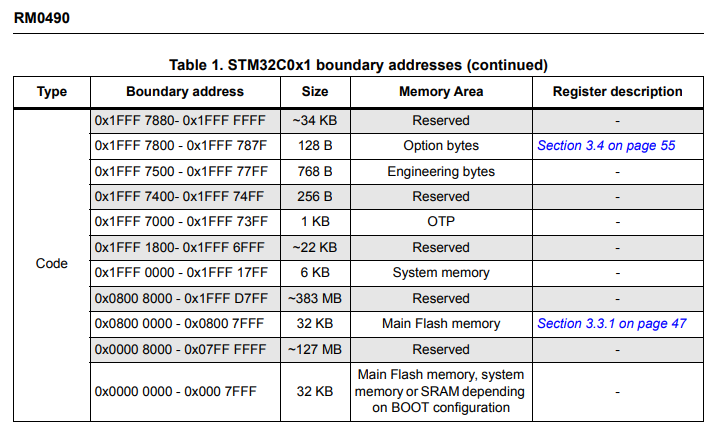
The STM32C0x1 boundary addresses table then goes on to provide additional detail on the breakdown of the code block. In this table, you will find the specific boundary address, size, memory area type and if applicable register description available within the code block.
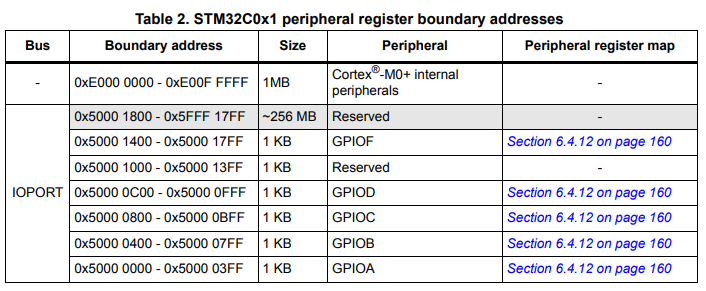
On the other hand, the STM32C0x1 peripheral register boundary addresses table provides additional detail on the breakdown of the peripherals within the STM32C0 device. In this table, you will find the bus that the peripheral resides on, the peripheral’s boundary address, the size of the peripheral’s block, and if applicable the register map of the peripheral.
The peripheral register map provides an overview of the various registers available for the specified peripheral. The information provided includes address offset, register name, reset value, and register bit name.
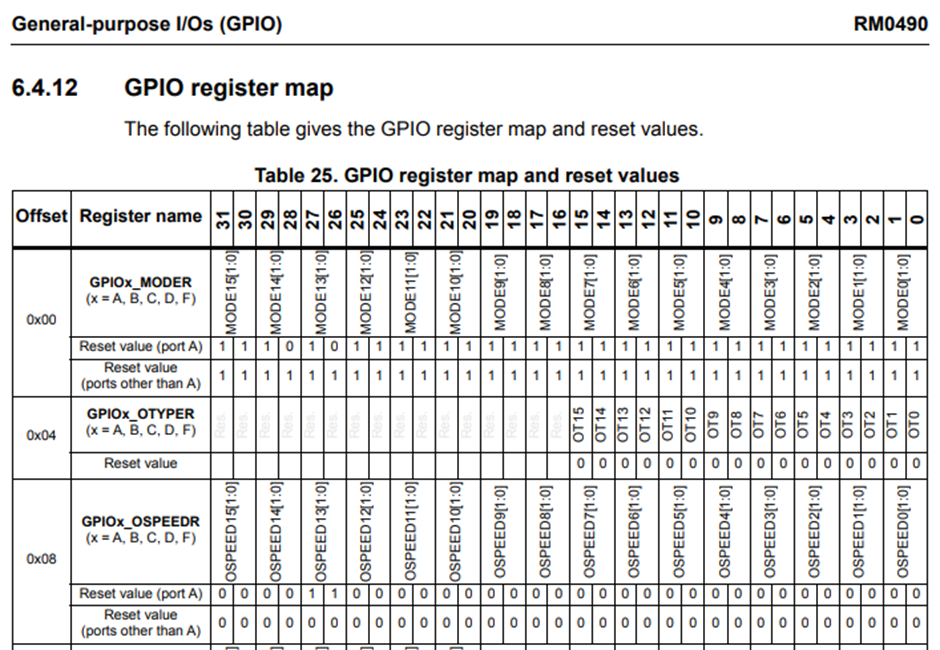
For more information regarding the specific bit definitions, please refer to the specific register section also located within the device’s reference manual.

Now that we have located the device’s available memory and peripheral registers, we can use STM32CubeProgrammer to perform a register dump.
STM32CubeProgrammer register dump using the GUI
Step 1. Select the memory or peripheral’s whose registers you want to read out. As an example, we will select GPIOF’s registers to review. According to table 2 in the STM32C0’s reference manual, GPIOF’s start boundary address is 0x5000_1400.
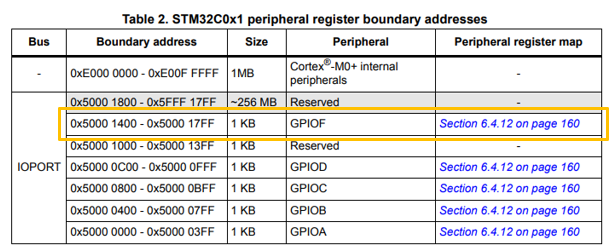
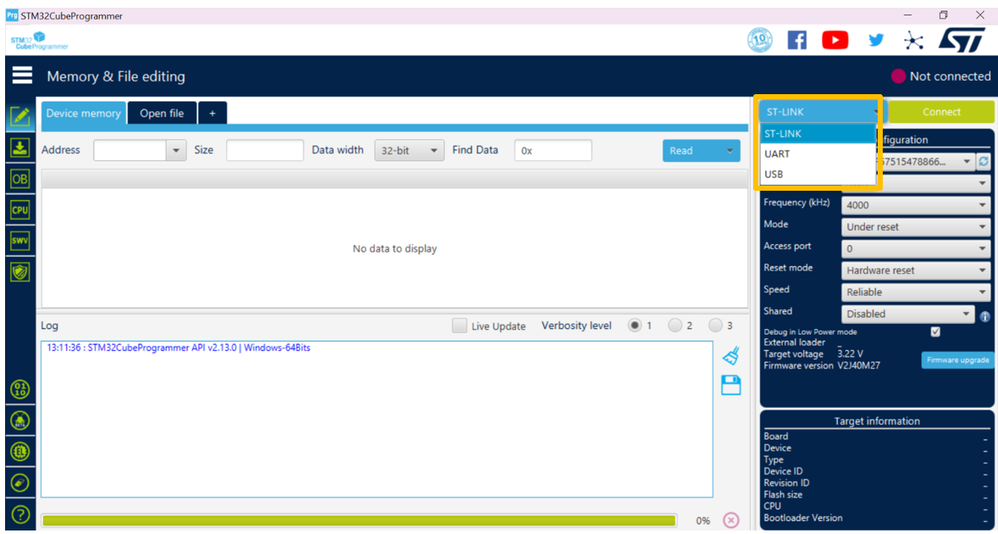
Step 2. Power the Nucleo-C031C6 board using your host computer, and connect to STM32CubeProgrammer through the on-board STLINK. You will want to make sure that the ‘ST-LINK’ is selected using the blue drop-down menu.
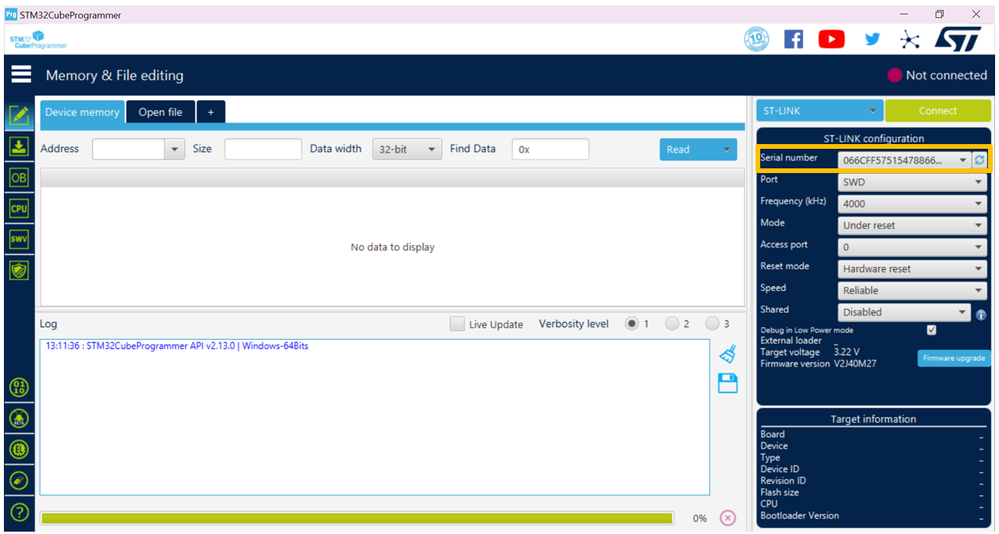
Sometimes upon initial connection you may see a “No STLINK detected” message in the serial number port, click on the ‘refresh’ icon to refresh and update the section to reflect the Nucleo-C031C6’s STLINK’s serial number.
Step 3. Upon hitting on the green ‘connect’ icon, STM32CubeProgrammer should display the device’s current flash memory contents starting at 0x0800_0000.
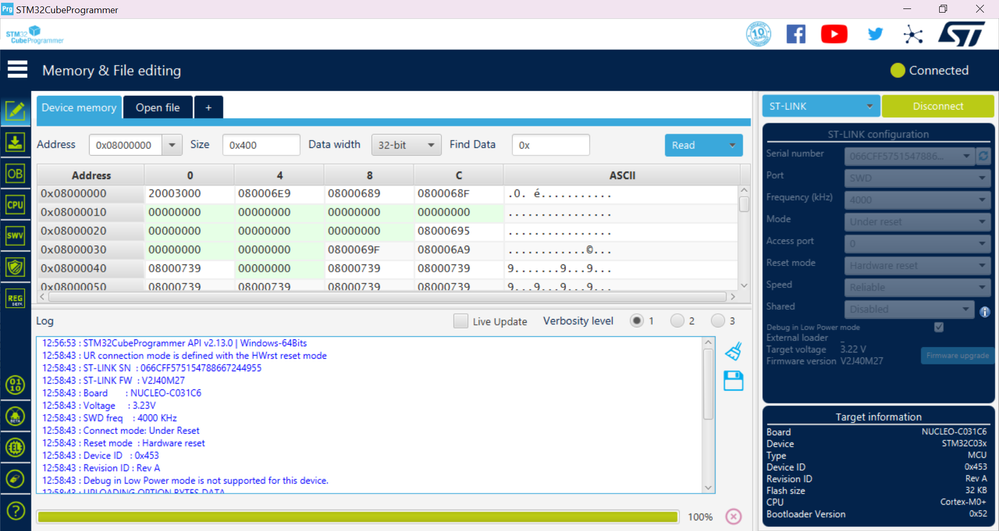
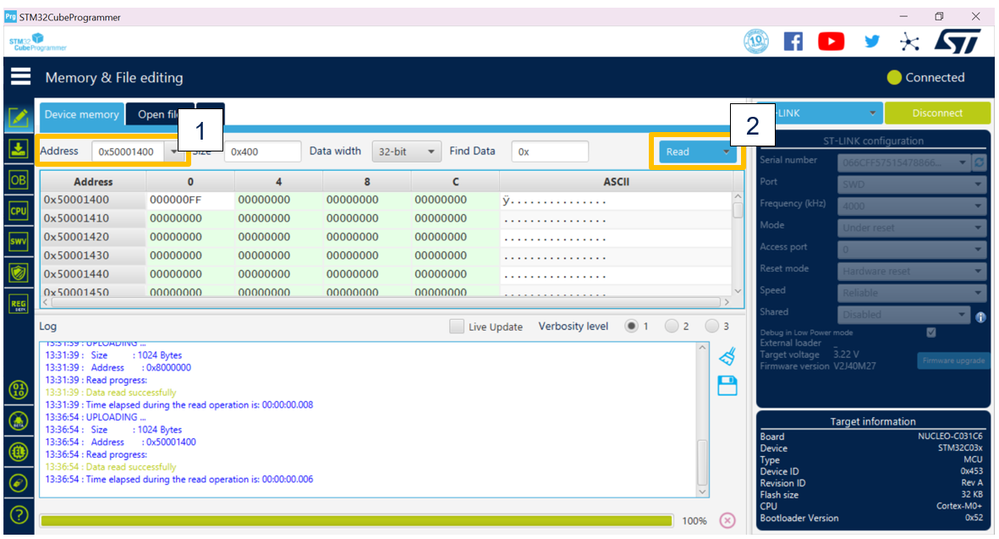
Step 4. In step 1 we had predetermined that we wanted to review the contents of GPIOF’s register at address 0x5000_1400. To view the contents at this address, we will need to update the section’s default value of 0x0800_0000 to 0x5000_1400.
In addition, as you can seen on the right-hand side of the address section there are a few other view selections we can choose to modify, size and data width.
Once you’ve modified the address section to 0x5000_1400 you can hit enter on your keyboard or the ‘read’ icon to display the GPIOF’s register contents on the screen.
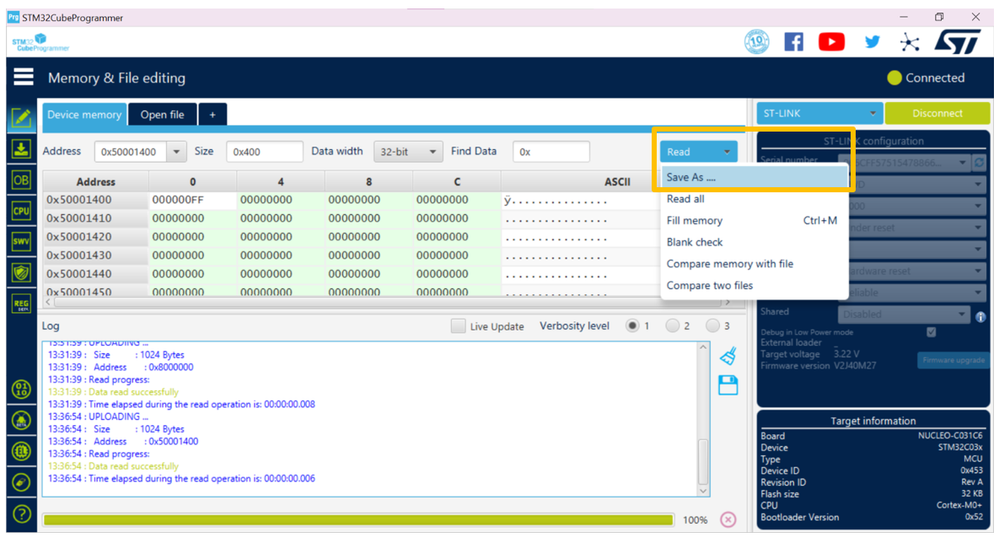
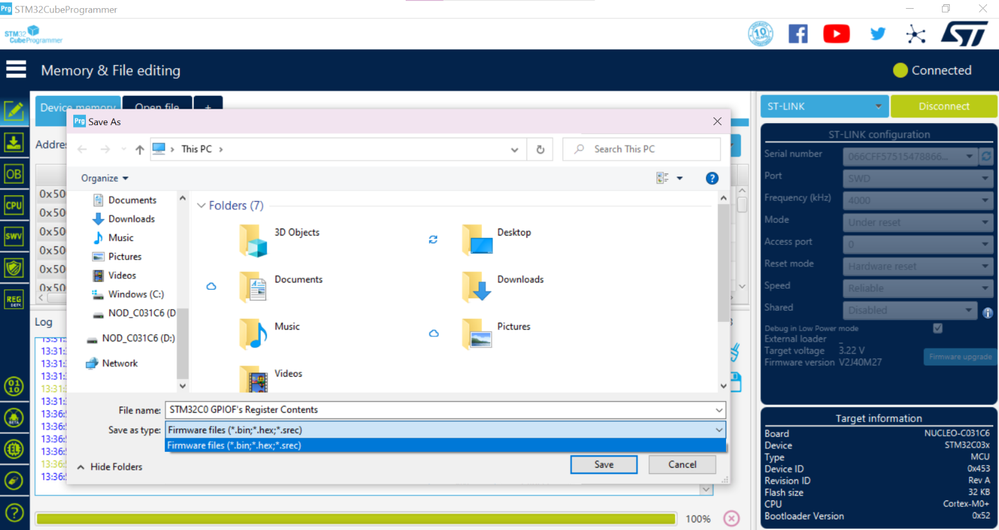
Step 5. To save the device’s memory contents into a .bin, .hex or .srec file use the ‘Save As’ option from the ‘Read’ icon’s drop-down menu.
STM32CubeProgrammer register dump using the CLI
Now we will pivot over to doing a register dump using STM32CubeProgrammer’s CLI using the STM32G071RB target device.
Note that by default the STM32CubeProgrammer CLI version is not available in the path. The path to the STM32CubeProgrammer binary must be added to the PATH environment variable.
In the case of the CLI, you are not given an option to do a register dump of a range of addresses. Instead, the CLI will perform an entire register dump of all available registers when using the -regdump command as shown in step 2.
Step 1. Launch STM32CubeProgrammer’s CLI, with the STM32G071RB target device plugged in to the host computer.
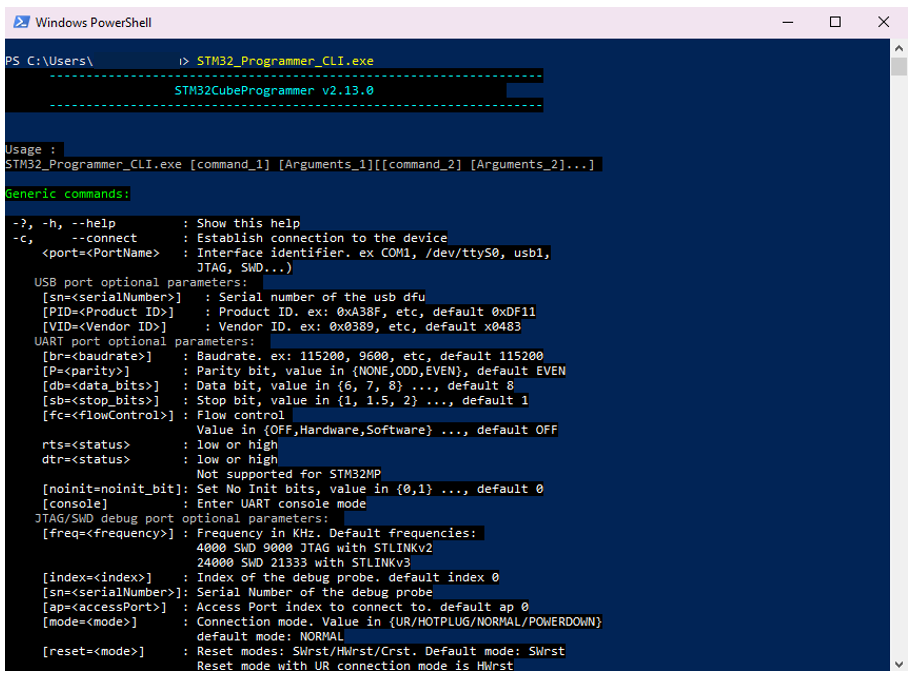
Note to launch command line interface on macOS call
STM32CubeProgrammer.app/Contents/MacOS/bin/STM32_Programmer_CLI
Step 2. Enter in the following command in the terminal:
STM32_Programmer_CLI.exe -c port=swd mode=hotplug -regdump C:\test\STM32G0.log
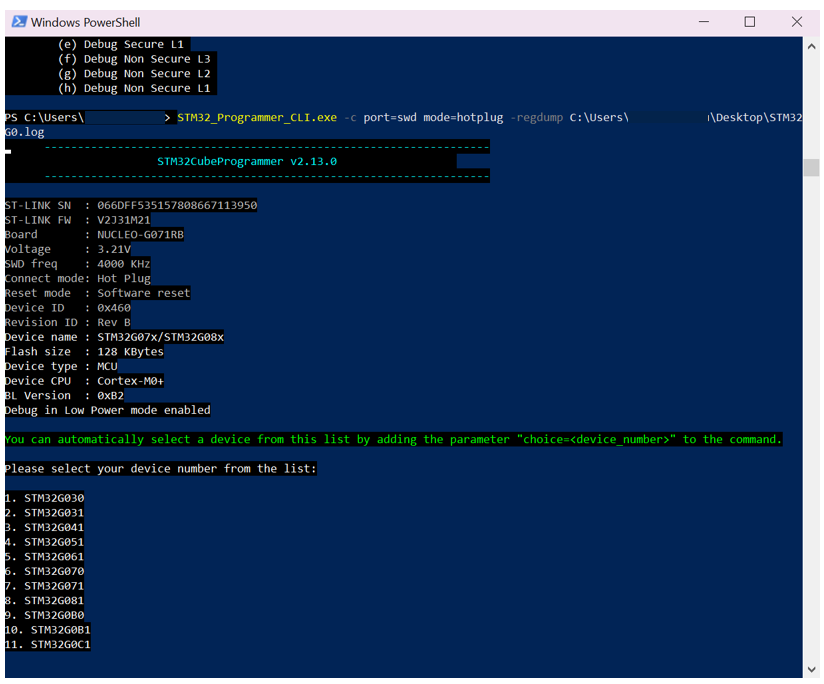
This command will connect to the STM32 target device and save the contents of the register dump to a generated STM32G0.log file. Note that the path to store the .log file is anywhere on the host computer of your choice.
Step 3. Select the device number (STM32G071RB) from the populated list and hit the enter key on the keyboard. In this case, STM32G071 is number 7 on the list.
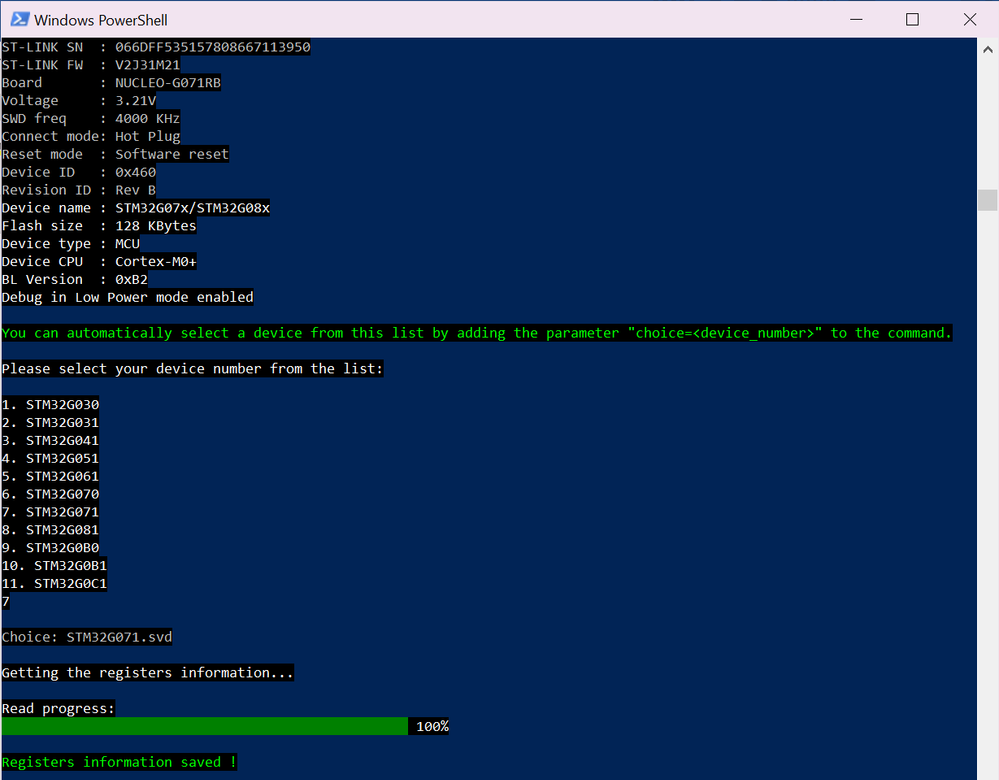
Step 4. Navigate to the STM32G071.log path file defined in step 2. Upon opening the .log file, you will see all the STM32G071’s registers and contents populated and saved in the file.

Step 5. (optional) On the other hand, you can also use STM32CubeProgrammer to perform a read of an address range. This is similar to the GPIOF register dump that we did using the STM32CubeProgrammer GUI above. For this exercise, we will revert back to using the STM32C0 as the target device.
Using the CLI, call 1 of the 3 following commands, the different files supported for the reading of the registers are .bin, .hex and .srec:
STM32_Programmer_CLI.exe -c port=swd mode= hotplug -r 0x50001400 0x400 ./dump.bin
STM32_Programmer_CLI.exe -c port=swd mode= hotplug -r 0x50001400 0x400 ./dump.hex
STM32_Programmer_CLI.exe -c port=swd mode= hotplug -r 0x50001400 0x400 ./dump.srec
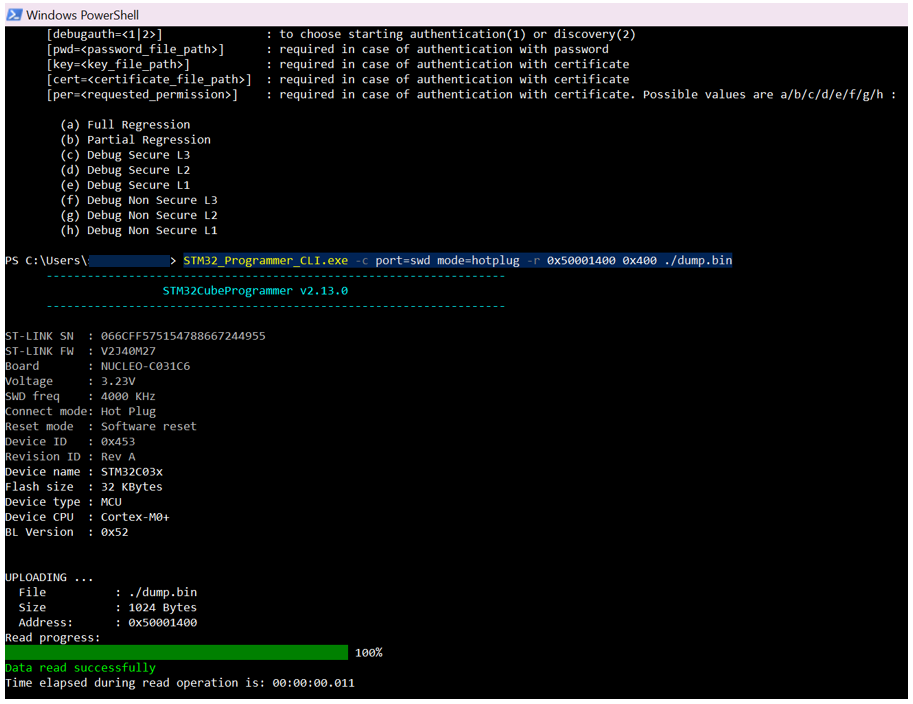
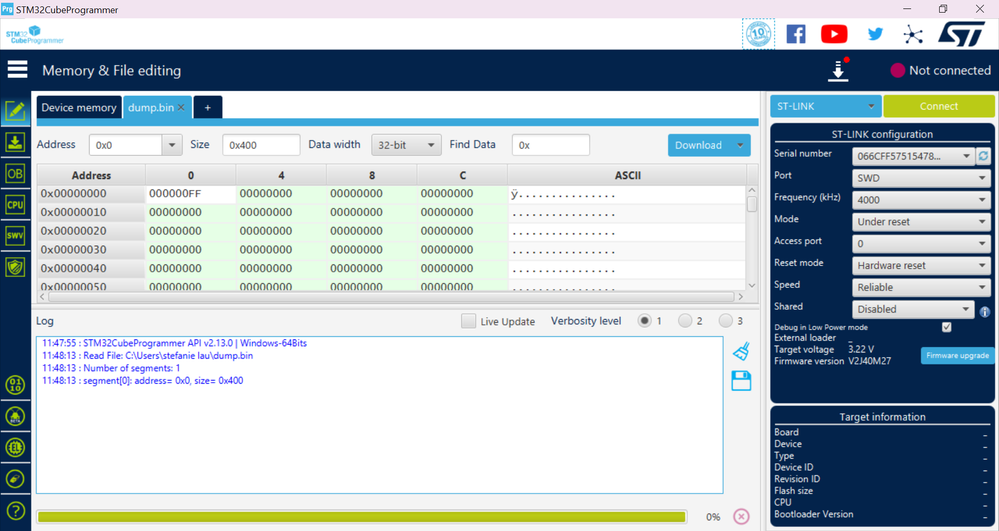
Congratulations! You now know how to perform a register dump of a STM32 target device using STM32CubeProgrammer GUI and CLI.
Relevant Links & Documentation:
Keeping up to date with the latest version of STM32CubeProgrammer
It is recommended to always keep up to date with the latest version of STM32CubeProgrammer. You can find the latest version of STM32CubeProgrammer on st.com. See the relevant documentation and links section at the end of this article for direct link to STM32CubeProgrammer’s landing page.
On the other hand, if you already have STM32CubeProgrammer installed on your system you can refer to the steps below to check your current STM32CubeProgrammer version, and if there are any updates available.
Step 1. Launch the STM32CubeProgrammer GUI (graphical user interface). In the bottom left-hand corner of the screen, select the ‘?’ icon. Then select the ‘Software Update’ option.

Step 2. A STM32CubeProgrammer updater pop-up window will appear. Note that the contents of this window may differ, depending on the current version of STM32CubeProgrammer you are running. If you have any updates to make, please follow the pop-up window’s on-screen prompts.

In this article, we will use the STM32C031C6 and STM32G071RB as our reference target devices. We will then use STM32CubeProgrammer to demonstrate how to perform a register dump via the GUI (graphical user interface) using the STM32C031C6 and the CLI (command line interface) using the STM32G071RB.
We will first start with doing a register dump using the GUI with the STM32C031C6. We will first need to locate the list of registers accessible within this STM32 device, these registers can be found in the device’s reference manual.
Every STM32 comes with a corresponding reference manual. In the reference manual you will find all sorts of required information that is provided for application, in particular software development.
To locate the appropriate reference manual for our target STM32 device, we will first start by going on st.com and search for the STM32C031C6’s landing page.

Next, select the ‘Documentation’ tab:

From the quick links’ menu, you can select the ‘Reference Manuals’ hyperlink or you can scroll down the page and locate the document under the ‘Reference Manuals’ section:

There are several views available in the device’s reference manual that show and explain the memory and register’s organization. In our device of choice, the STM32C0, these figures and tables are as follows:
- Memory map and register boundary addresses
- STM32C0x1 boundary addresses
- STM32C0x1 peripheral register boundary addresses
- Peripheral register map

The STM32C0x1 boundary addresses table then goes on to provide additional detail on the breakdown of the code block. In this table, you will find the specific boundary address, size, memory area type and if applicable register description available within the code block.

On the other hand, the STM32C0x1 peripheral register boundary addresses table provides additional detail on the breakdown of the peripherals within the STM32C0 device. In this table, you will find the bus that the peripheral resides on, the peripheral’s boundary address, the size of the peripheral’s block, and if applicable the register map of the peripheral.

The peripheral register map provides an overview of the various registers available for the specified peripheral. The information provided includes address offset, register name, reset value, and register bit name.

For more information regarding the specific bit definitions, please refer to the specific register section also located within the device’s reference manual.

Now that we have located the device’s available memory and peripheral registers, we can use STM32CubeProgrammer to perform a register dump.
STM32CubeProgrammer register dump using the GUI
Step 1. Select the memory or peripheral’s whose registers you want to read out. As an example, we will select GPIOF’s registers to review. According to table 2 in the STM32C0’s reference manual, GPIOF’s start boundary address is 0x5000_1400.

Step 2. Power the Nucleo-C031C6 board using your host computer, and connect to STM32CubeProgrammer through the on-board STLINK. You will want to make sure that the ‘ST-LINK’ is selected using the blue drop-down menu.

Sometimes upon initial connection you may see a “No STLINK detected” message in the serial number port, click on the ‘refresh’ icon to refresh and update the section to reflect the Nucleo-C031C6’s STLINK’s serial number.

Step 3. Upon hitting on the green ‘connect’ icon, STM32CubeProgrammer should display the device’s current flash memory contents starting at 0x0800_0000.

Step 4. In step 1 we had predetermined that we wanted to review the contents of GPIOF’s register at address 0x5000_1400. To view the contents at this address, we will need to update the section’s default value of 0x0800_0000 to 0x5000_1400.
In addition, as you can seen on the right-hand side of the address section there are a few other view selections we can choose to modify, size and data width.
- Size pertains to the size of the data to be read and displayed in the device memory window
- Data width pertains to the different display formats (e.g. 8-, 16-, and 32-bit)
Once you’ve modified the address section to 0x5000_1400 you can hit enter on your keyboard or the ‘read’ icon to display the GPIOF’s register contents on the screen.

Step 5. To save the device’s memory contents into a .bin, .hex or .srec file use the ‘Save As’ option from the ‘Read’ icon’s drop-down menu.


STM32CubeProgrammer register dump using the CLI
Now we will pivot over to doing a register dump using STM32CubeProgrammer’s CLI using the STM32G071RB target device.
Note that by default the STM32CubeProgrammer CLI version is not available in the path. The path to the STM32CubeProgrammer binary must be added to the PATH environment variable.
In the case of the CLI, you are not given an option to do a register dump of a range of addresses. Instead, the CLI will perform an entire register dump of all available registers when using the -regdump command as shown in step 2.
Step 1. Launch STM32CubeProgrammer’s CLI, with the STM32G071RB target device plugged in to the host computer.

Note to launch command line interface on macOS call
STM32CubeProgrammer.app/Contents/MacOS/bin/STM32_Programmer_CLI
Step 2. Enter in the following command in the terminal:
STM32_Programmer_CLI.exe -c port=swd mode=hotplug -regdump C:\test\STM32G0.log

This command will connect to the STM32 target device and save the contents of the register dump to a generated STM32G0.log file. Note that the path to store the .log file is anywhere on the host computer of your choice.
Step 3. Select the device number (STM32G071RB) from the populated list and hit the enter key on the keyboard. In this case, STM32G071 is number 7 on the list.

Step 4. Navigate to the STM32G071.log path file defined in step 2. Upon opening the .log file, you will see all the STM32G071’s registers and contents populated and saved in the file.

Step 5. (optional) On the other hand, you can also use STM32CubeProgrammer to perform a read of an address range. This is similar to the GPIOF register dump that we did using the STM32CubeProgrammer GUI above. For this exercise, we will revert back to using the STM32C0 as the target device.
Using the CLI, call 1 of the 3 following commands, the different files supported for the reading of the registers are .bin, .hex and .srec:
STM32_Programmer_CLI.exe -c port=swd mode= hotplug -r 0x50001400 0x400 ./dump.bin
STM32_Programmer_CLI.exe -c port=swd mode= hotplug -r 0x50001400 0x400 ./dump.hex
STM32_Programmer_CLI.exe -c port=swd mode= hotplug -r 0x50001400 0x400 ./dump.srec


Congratulations! You now know how to perform a register dump of a STM32 target device using STM32CubeProgrammer GUI and CLI.
Relevant Links & Documentation:
This discussion is locked. Please start a new topic to ask your question.
0 REPLIES 0