
Associate
June 30, 2025
Solved

Build Analyzer underestimates by 30% Flash memory usage

  • June 30, 2025
  • 15 replies
  • 2369 views

Hello everybody,

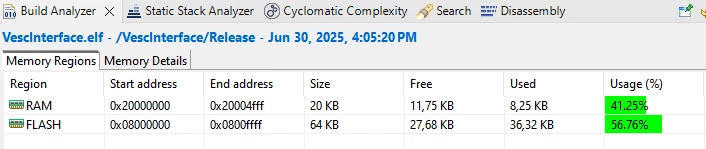
I have this project for the STM32F103C8 where the build analyzer of STM32CubeIDE says that only ~57% of flash is used:
Valerio3_0-1751296879737.png

but while I'm flashing, it shows that the erased sectors are 0 to 56 (out of 63):

Valerio3_1-1751296957820.png

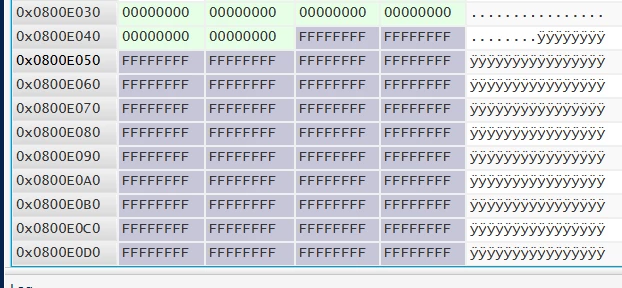
and also using the STM32Programmer I see that the empty region starts at 0x800E048
Valerio3_2-1751297150366.png

Now 56/63 ≈ 0xE048/0xFFFF ≈ 87% which is 30% higher than the stated 57% of build analyzer. This is kind of a bummer because now I will have to upgrade MCU since some other features must still be added to the project.

How is it possible such a difference?

This topic has been closed for replies.
Best answer by Valerio3

I have finally found what is happening here.

When running the code from the CubeIDE via EITHER these buttons  Valerio3_2-1751623528006.png it always loads to the MCU the debug version (regardless of the active configuration). While I thought that the rightmost one would have loaded the current active configuration (which is always set to "release").

The build analyzer on the other hand shows the size of the active configuration (i.e. "release").

Therefore to load the "small" version of the firmware I have to start the build all, and load the hex from the release folder using the STM32CubeProgrammer (or probably I will use an STM32_Programmer_CLI.exe command placed in the post-build, but I also think that there is a possibility to change the run configuration).

To me this is good on one side (i.e. I don't need to switch to a bigger mcu because the remaining 43% is enough to complete the project) but it also means that from a certain point onward I won't be able to debug the code, but only run it.

Thanks to all the contributors to this issue, I hope that this may help someone else.

15 replies

TDK
June 30, 2025

Are you using the same (Release) configuration when flashing? No doubt Debug will be using more flash memory.

"If you feel a post has answered your question, please click ""Accept as Solution""."
Valerio3Author
Associate
July 1, 2025

Yes. All release. Also deleted release folder, build clean and rebuild, in various order. Same result.

Ozone
Principal
July 1, 2025

> ... but while I'm flashing, it shows that the erased sectors are 0 to 56 (out of 63):

Check the datasheet. Not all sectors are of equal size.
I don't know the F103C8 in detail.

Valerio3Author
Associate
July 1, 2025

@Ozone wrote:

> ... but while I'm flashing, it shows that the erased sectors are 0 to 56 (out of 63):

Check the datasheet. Not all sectors are of equal size.
I don't know the F103C8 in detail.


That was the reason that made me suspicious but I knew it was not conclusive (also because it says "erased sectors" and maybe it erased more than needed), therefore I double checked by reading back the memory with the stm32programmer. According to Build Analyzer I should see a lot more FFFF's.

Ozone
Principal
July 1, 2025

I am doubtful the "stm32programmer" and "Build Analyzer" are proper criteria.
The programmer software probably erased only sectors touched, and the latter evaluates bytes (or words) used vs. available.

I would check the map file, this should be unambiguous.
Which is, I strongly suspect, the main source of information for the "Build Analyzer".


> Yes 1k of eeprom emulation (last k of flash memory, but it doesn't explain that big difference).

That is only 1k if the actual size of the used Flash sector is 1k.
I suppose you know only whole Flash sectors can be erased, not single bytes or words.

RobK1
Associate II
July 1, 2025

The last part of the programmed memory is all 0, what's with that? 

Are there gaps in the code? Are you using EEPROM emulation?

Valerio3Author
Associate
July 1, 2025

@RobK1 wrote:

The last part of the programmed memory is all 0, what's with that? 

Are there gaps in the code? Are you using EEPROM emulation?


Yes 1k of eeprom emulation (last k of flash memory, but it doesn't explain that big difference). No gaps in the code. Just above those zeros (they are about 30) there are non zero data (not shown in the picture).

Valerio3AuthorBest answer
Associate
July 4, 2025

I have finally found what is happening here.

When running the code from the CubeIDE via EITHER these buttons  Valerio3_2-1751623528006.png it always loads to the MCU the debug version (regardless of the active configuration). While I thought that the rightmost one would have loaded the current active configuration (which is always set to "release").

The build analyzer on the other hand shows the size of the active configuration (i.e. "release").

Therefore to load the "small" version of the firmware I have to start the build all, and load the hex from the release folder using the STM32CubeProgrammer (or probably I will use an STM32_Programmer_CLI.exe command placed in the post-build, but I also think that there is a possibility to change the run configuration).

To me this is good on one side (i.e. I don't need to switch to a bigger mcu because the remaining 43% is enough to complete the project) but it also means that from a certain point onward I won't be able to debug the code, but only run it.

Thanks to all the contributors to this issue, I hope that this may help someone else.

Andrew Neil
Super User
July 7, 2025

@Valerio3 wrote:

When running the code from the CubeIDE via EITHER these buttons  Valerio3_2-1751623528006.png it always loads to the MCU the debug version (regardless of the active configuration). .


That's not true.

It runs whatever Debug Configuration is currently the default on those buttons.

You could create a Debug Configuration which loads the Release build.

If you click the little down arrows, you will get a list of what Debug Configurations are available, and the option to configure them or create a new one.

A complex system that works is invariably found to have evolved from a simple system that worked.A complex system designed from scratch never works and cannot be patched up to make it work.
Valerio3Author
Associate
July 7, 2025

Yes of course, now I have understood it.

But apparently by default (since I started the project from scratch and I did not customize either debug or release configuration and always used the release one) those two buttons are mapped one to "debug the debug configuration" and the other to "run the debug configuration". That was my mistake, thinking that the green arrow button would have loaded and run the release configuration. Now thanks to @AScha.3  I also have a better understanding on how to customize and change optimization levels for both configurations.

Thanks.
