

Why CubeIDE Debugger Starts 2 GDB Clients
I started a debug session on Cube IDE (version : 2.2.0) for my STM32F303 Discovery board.
I got curious about GDB and I discovered that when I start a debug session, two GDB clients listening to the same GDB server are created.
Why does it start two GDB clients?


One other confusion, whenever I start a new GDB client that listens to same GDB server, the console in Cube IDE prints the message “Waiting for debugger connection”. But when I monitor its TCP connection, I can see that its two gdb clients did not disconnect. And when I halt or resume the program execution or send gdb commands via the debugger console like “info registers” for exemple, it works fine.
(I start my own GDB client by running the arm-none-eabi-gdb.exe executable)
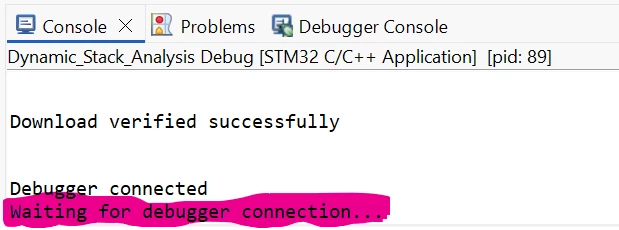
Any idea why the console print this message whenever a new GDB client connects to the GDB server?