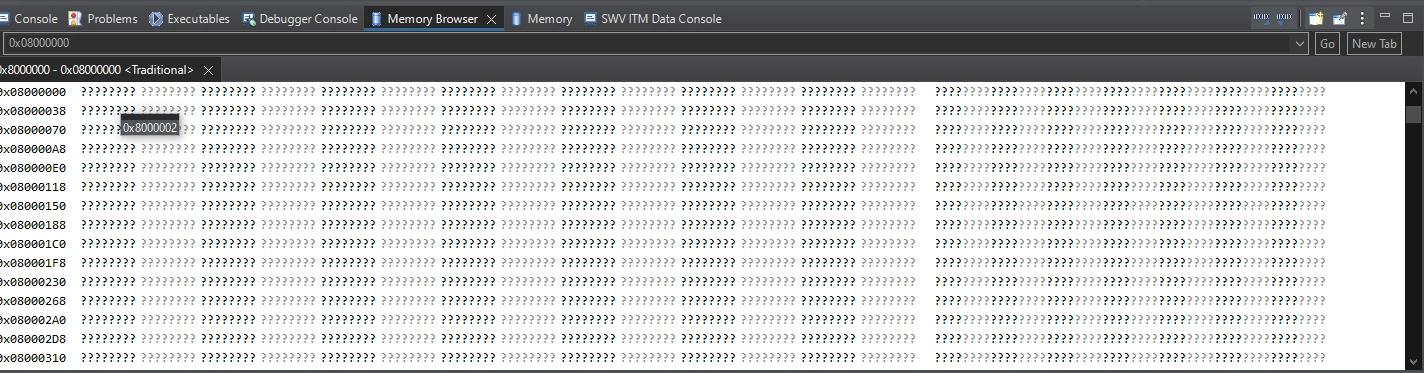
Why cannot properly see opcodes on memory browser ?
I can see the addresses when I hover over them, but I can't see the opcodes. Is there a setting to fix this or is it broken?
Starting server with the following options:
Persistent Mode : Disabled
Logging Level : 1
Listen Port Number : 61234
Status Refresh Delay : 15s
Verbose Mode : Disabled
SWD Debug : Enabled
InitWhile : Enabled
Waiting for debugger connection...
Debugger connected
Waiting for debugger connection...
Debugger connected
Waiting for debugger connection...
-------------------------------------------------------------------
STM32CubeProgrammer v2.16.0
-------------------------------------------------------------------
Log output file: C:\Users\Shichaz\AppData\Local\Temp\STM32CubeProgrammer_a18664.log
ST-LINK SN : 0671FF575377524867053453
ST-LINK FW : V2J45M30
Board : STM32F4DISCOVERY
Voltage : 2.91V
SWD freq : 4000 KHz
Connect mode: Under Reset
Reset mode : Hardware reset
Device ID : 0x413
Revision ID : Rev Y
Device name : STM32F405xx/F407xx/F415xx/F417xx
Flash size : 1 MBytes
Start Address : 8000000
Device type : MCU
Device CPU : Cortex-M4
BL Version : 0x91
Memory Programming ...
Opening and parsing file: ST-LINK_GDB_server_a18664.srec
File : ST-LINK_GDB_server_a18664.srec
Size : 4.93 KB
Address : 0x08000000
Erasing memory corresponding to segment 0:
Erasing internal memory sector 0
Download in Progress:
File download complete
Time elapsed during download operation: 00:00:00.372
Verifying ...
Download verified successfully