
Associate III
May 4, 2025 10:00 AM UTC
Solved

View Memory allocation as a GUI

Hello Experts,

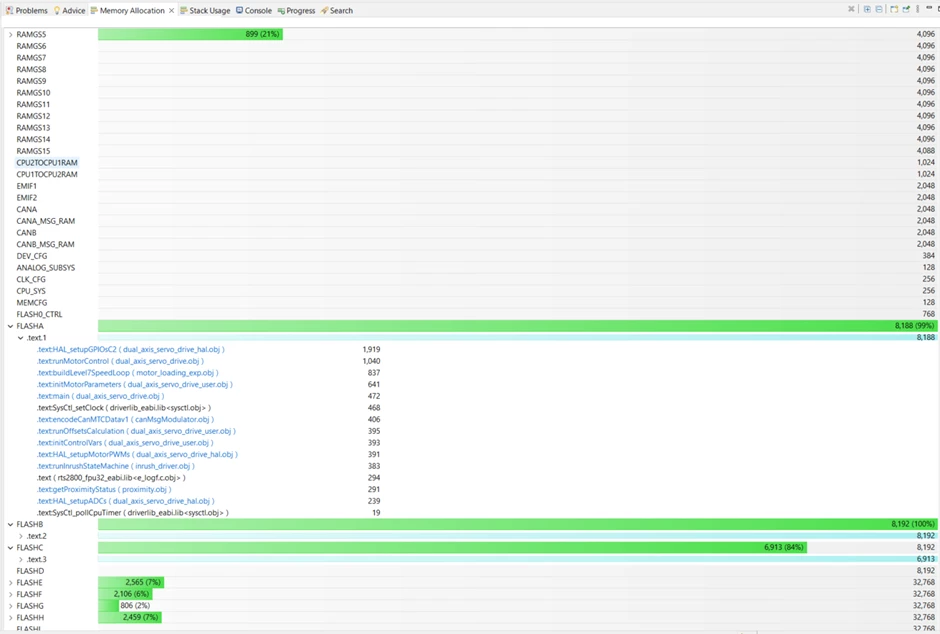
Is it possible to view the memory allocation in a nice GUI format, something like this: (see image)

The image is an example of what i am looking for (from code composer studio IDE).

Basically it autoloads the data from .map file and displays it graphically!, cool thing here is that we can see where functions and variables are located along with its size and its loading addresses. for doing any analysis.

Analyzing large .map files directly can sometimes be cumbersome.
ak52_0-1746351727028.png


This topic has been closed for replies.
KnarfB
KnarfBBest answer
Super User
May 4, 2025 10:31 AM UTC

The STM32CubeIDE  Build Analyzer has a similar thing: Memory Regions and Memory Details tab.

hth

KnarfB

2 replies

KnarfB
KnarfBBest answer
Super User
May 4, 2025 10:31 AM UTC

The STM32CubeIDE  Build Analyzer has a similar thing: Memory Regions and Memory Details tab.

hth

KnarfB

ak52Author
Associate III
May 5, 2025 2:44 AM UTC

Thanks, this is exactly what i was looking for!