

SWV Statistical Profiling: data is not useful since it only shows 'exclusive' samples
I'm trying to use SWV Statistical Profiling to see what part of my codebase takes up so much time. This looks like the screenshot below (project-unique function names removed):
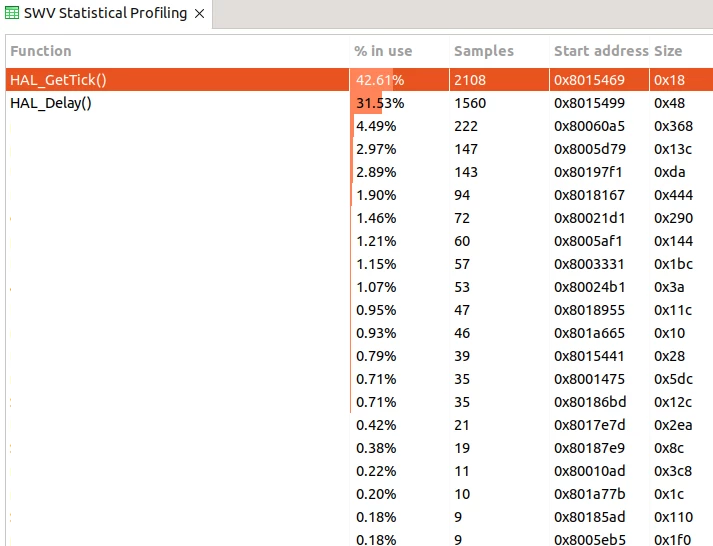
The problem is that a lot of functions call HAL_Delay(); I can see that a lot of time is spent sleeping, but not by which functions. This is because this SWV profiler only shows 'exclusive' samples: at sample-time it only looks at the deepest function, it does not look at what functions called the function we are currently in.
VisualGDB does this a lot better: it show a tree-style view (it likely does this by walking up the callstack at sample-time), see https://visualgdb.com/tutorials/profiler/embedded/sampling/
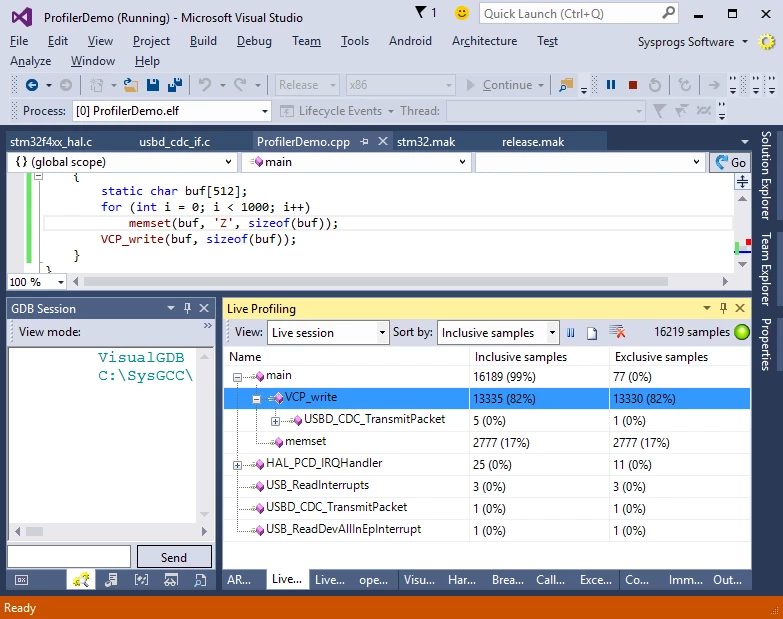
Is it possible to also get a metric for 'inclusive samples' with STM32CubeIDE?