


Restart session from debugger in custom memory location STM32CubeIDE
Hi guys,
I have reserved 8K of flash in my STM32F030CC for a bootloader/updater program so my main application starts at 0x08002000. When I compile and debugg, the debugger is smart enough to know where to start, but when I click on reset session and start debug the chip seems to be reset and I guess it tries to start at 0x08000000. Is there anyway to tell the debugger to start where my application code starts after a reset?
I have tried the option "Set PC at 0x08002000" which is where the flash for the app image starts, as seen in the picture but there is no breakpoint at start from where to start.
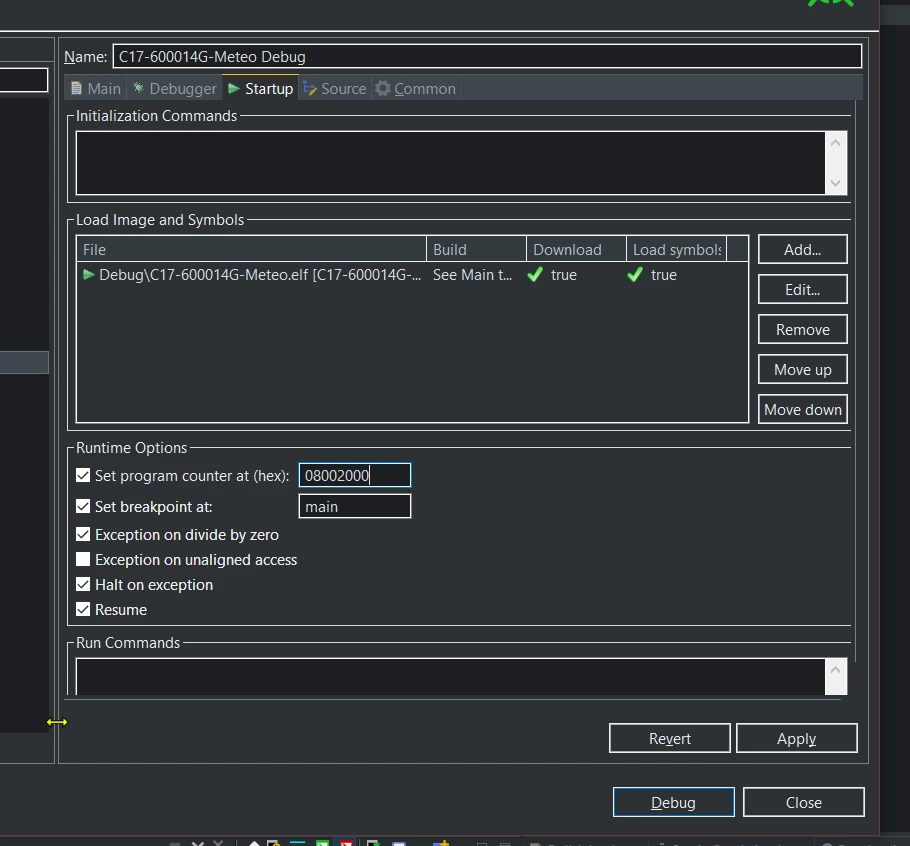
have also modified the script for the linker as follows.
MEMORY
{
 UPDATER (rx) : ORIGIN = 0x08000000, LENGTH = 8K
/* FIRMWARE (rx) : ORIGIN = 0x08002000, LENGTH = 240K*/
 FIRMWARE (rx) : ORIGIN = 0x08002000, LENGTH = 132K
 LOGGER (r) : ORIGIN = 0x08023000, LENGTH = 108K
 PARAMS (r) : ORIGIN = 0x0803E000, LENGTH = 8K
 VTRAM (xrw) : ORIGIN = 0x20000000, LENGTH = 0xc0 /* First part of RAM is reserved to the vector table */
 RAM (xrw) : ORIGIN = 0x200000C0, LENGTH = 32K - 192
}

REGION_ALIAS( "FLASH", FIRMWARE );

_main_app_start_address = 0x08002000;
_logger_start_address = 0x08023000;
/*_logger_start_address = 0x0000;*/
_logger_events_start_address = 0x08037000; /* events start address*/
_params_start_address = 0x0803E000;
_main_app_size = 132K;
_logger_size = 108K;
_logger_meas_size = 80K; /* datalogger measures size */
/*_logger_meas_size = 7168K;*/ /* datalogger measures size */
_logger_event_size = 20K; /* datalogger events size */
_params_size = 8K;

.
.
.
.

 .ARM.attributes 0 : { *(.ARM.attributes) }
 /* RAM space for the vector table */
 .RAMVectorTable(NOLOAD): {*(.RAMVectorTable)} >VTRAM
The VTRAM is where I am remapping my vector table and I use the following code in the main:
__IO uint32_t VectorTable[48] __attribute__((section(".RAMVectorTable")));
.
.
.

 // Copy interrupt vector table to the RAM.
 uint32_t volatile ui32_VectorIndex = 0;

 for (ui32_VectorIndex = 0; ui32_VectorIndex < 48; ui32_VectorIndex++)
 {
 VectorTable[ui32_VectorIndex] = *(__IO uint32_t*) ( APPLICATION_ADDRESS + (ui32_VectorIndex << 2));
 }

 /* Reset SYSCFGRST peripheral clock */
 __HAL_RCC_APB2_FORCE_RESET();
 /* Enables SYSCFGRST peripheral clock */
 __HAL_RCC_SYSCFG_RELEASE_RESET();
 __HAL_RCC_APB2_RELEASE_RESET();

 /* Remap SRAM at 0x00000000 */
 __HAL_SYSCFG_REMAPMEMORY_SRAM();
This I believe works fine as I am getting the interrupts correctly and it was also working in atollic which I ported from.
Not sure if you can give some tips to configure the debugger to I can hit the restart session and debug without having to flash the memory again...
Thanks a lot in advance!!